By TechnologyAzure and AWS Monitoring
By IndustryIntegrates with your stack
By InitiativeEngineering & DevOps Teams
TechnicalIt’s easy to get the help you need

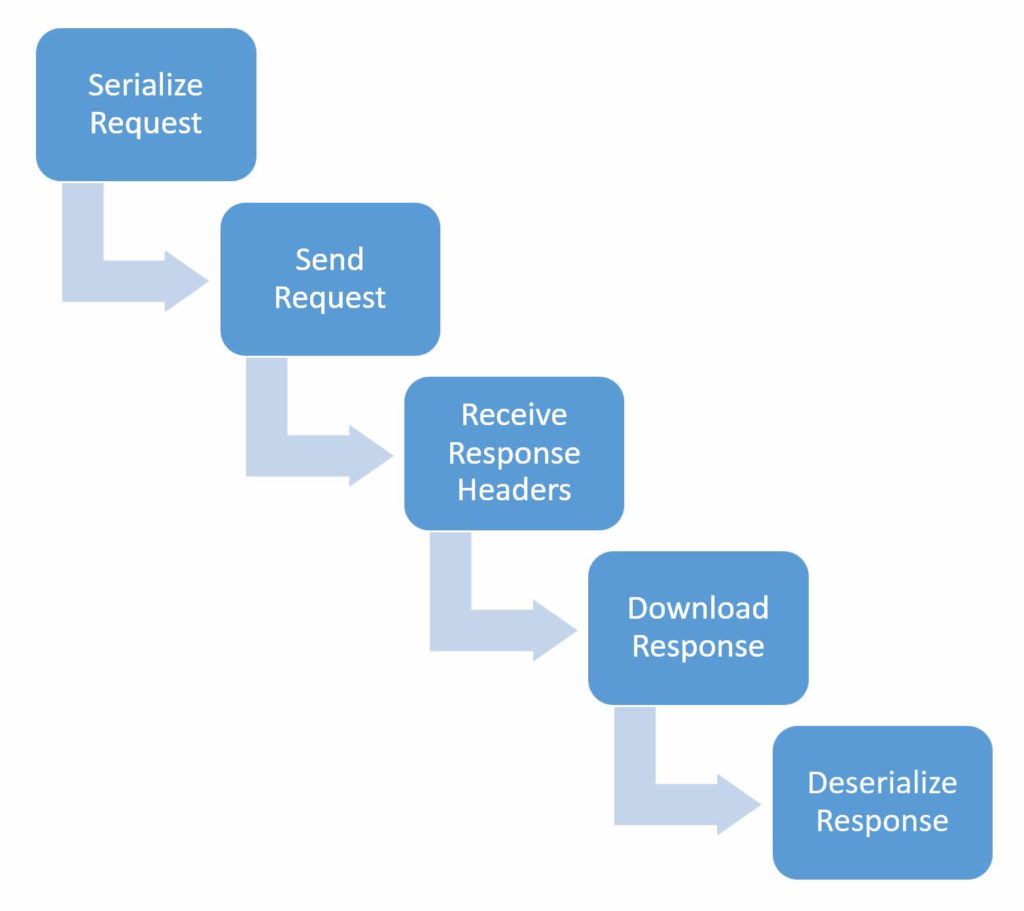
There are a lot of ways to make a web service or web request in .NET. Common libraries include HttpClient, WebClient, WCF generated clients, RestSharp, and, of course, your low-level HttpWebRequest/HttpWebResponse objects. If you want to track the true performance and amount of time it takes to make such a request, you need to understand all the steps involved in actually making a web service call. Like many areas in development, it is more complicated than you think! The diagram below helps illustrate the process.

The amount of time that it takes a remote server to process your request could be very fast in comparison to the amount of time it takes to serialize the request, send the request, download the response, and deserialize the response. For example, it could take a server virtually no time to send you a 10MB PDF file; however; it could take your code what seems like forever to download the entire response stream.
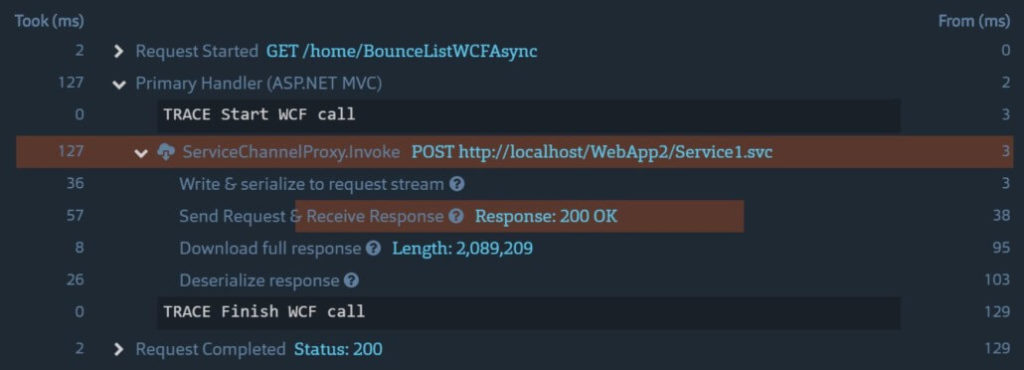
Below is a screenshot from Prefix showing a real request to a WCF service. This request uploads a list of users and immediately returns the same list. The amount of data being uploaded is about 2MB. As you can see below, Prefix can help you understand the true amount of time it takes to fully call a web service.

Most APM-type products do not account for this entire process. Many of them may report that the previous example took 57ms when it actually took 127ms of total time. Prefix and Stackify APM v3.0 can help you properly measure the real amount of time taken.
We have done thorough testing with 30+ different scenarios to ensure that our profiling and APM capabilities handle them all perfectly with Prefix v1.5 and Stackify APM v3.0.
Since we support low-level HttpWebRequests, we support virtually all Http libraries. But saying we 100% support them means we have done thorough testing to ensure we can also track serialization, upload, download, and deserialization time where applicable.
Stackify's APM tools are used by thousands of .NET, Java, PHP, Node.js, Python, & Ruby developers all over the world.
Explore Retrace's product features to learn more.
If you would like to be a guest contributor to the Stackify blog please reach out to stackify@stackify.com