If you work with SQL, you understand the importance of being able to monitor your queries, not to mention how critical it is to have an accurate analysis of how long queries take. Today, we’ll take a look at SQL Server Profiler, a tool for doing just that, how it works, some shortcomings (most notably, depreciation of its features), and alternatives.
An SQL server profiler is a tool for tracing, recreating, and troubleshooting problems in MS SQL Server, Microsoft’s Relational Database Management System (RDBMS). The profiler lets developers and Database Administrators (DBAs) create and handle traces and replay and analyze trace results. In a nutshell, it’s like a dashboard that shows the health of an instance of MS SQL Server.
While it’s a robust tool, many features are being deprecated by Microsoft. This is happening because most developers and DBAs feel a server side trace is a more robust option.
It works by giving DBAs and developers a high-level view of the operation of a system. Users create traces to capture data and monitor errors and other problems. They then use the profiler to store, retrieve, and view the results of many traces graphically for purposes of troubleshooting and repair. This function all happens on the client-side, meaning it uses resources on the same machine it’s monitoring.
To start the tool:
Below is a short list of the benefits of this tool to both developers and Database Administrators (DBAs). For a complete list, reference this document from Microsoft.
Though popular, it’s not the only way to trace and monitor an SQL server. The following alternatives perform a similar function.
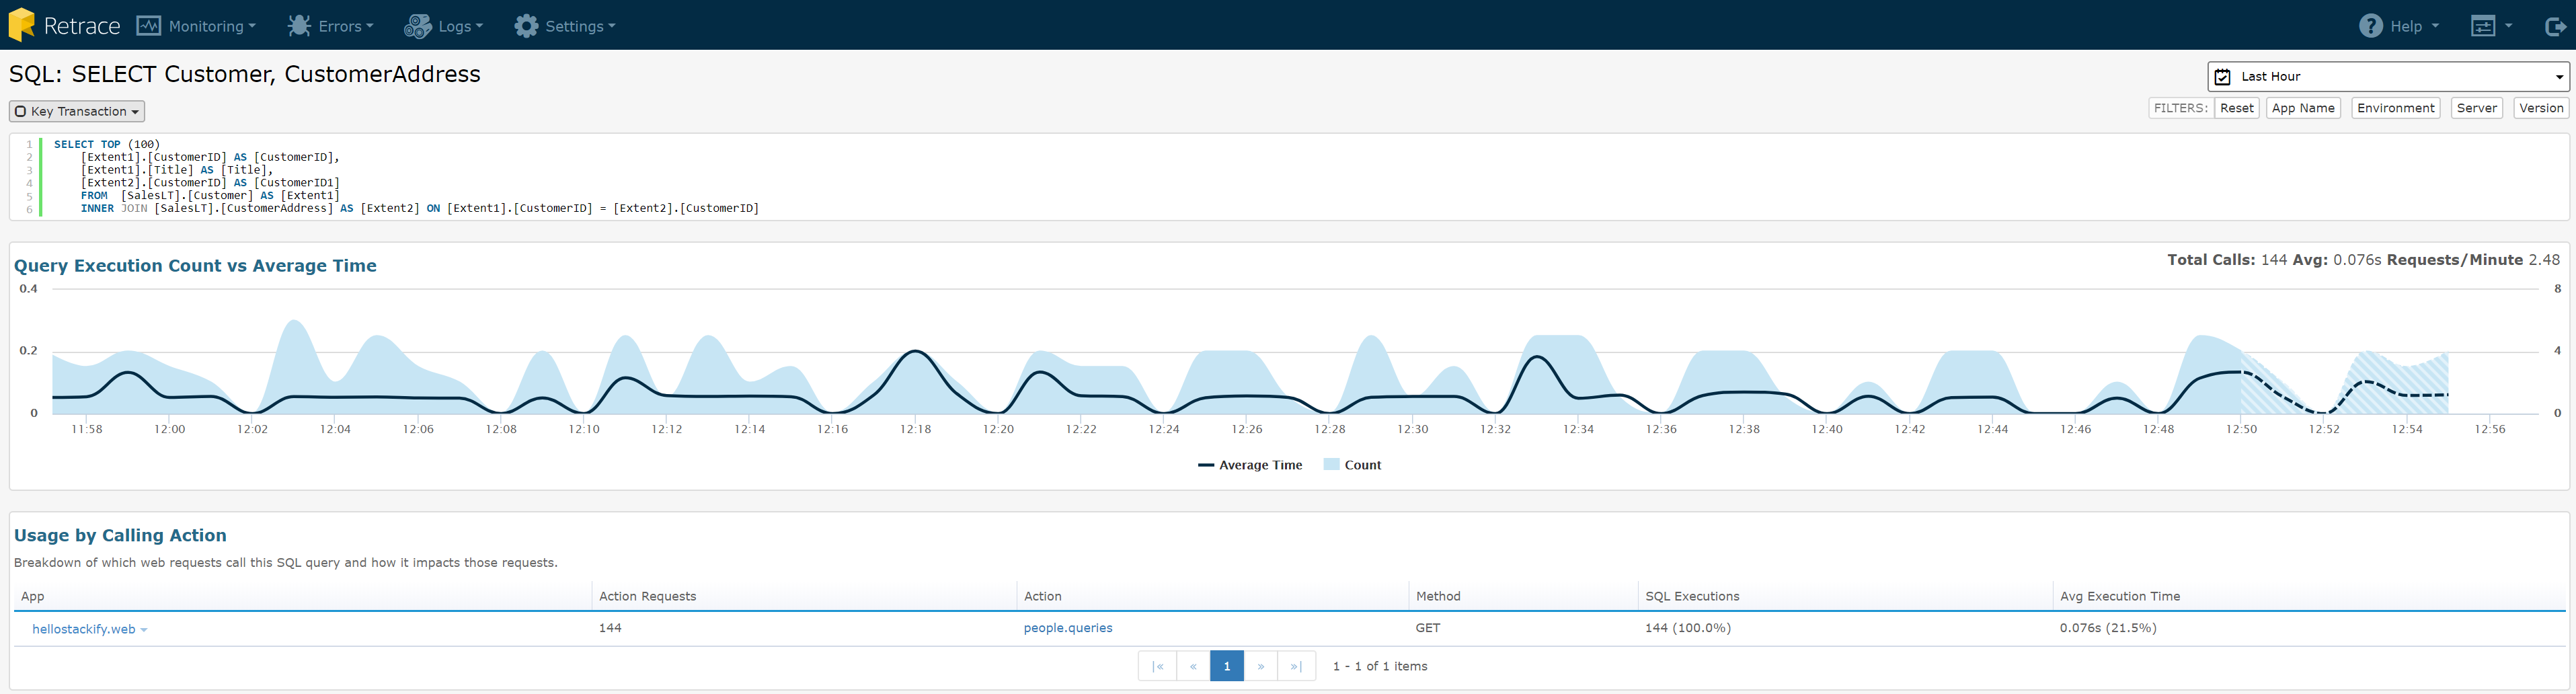
As you can see in the screenshot above, Retrace provides a detailed performance view that offers a variety of insights including:
Traces may actually use enough client-side resources to skew the results. Server-side traces are considered superior because they don’t use client-side resources. A Server Side Trace requires less overhead and performs more accurate monitoring and reporting.
Extended Events is Microsoft’s replacement for the profiler. Extended Events happens all on the server side, performing tracing, logging, and other functions efficiently.
For more info on server-side traces and Extended events, see the following:
Use this short list of best practices for efficiency. For a more comprehensive list of best practices, see this blog post.
This post is an introduction to the profiler. The following tutorials provide a more in-depth look at how to use it in practice:
Stackify's APM tools are used by thousands of .NET, Java, PHP, Node.js, Python, & Ruby developers all over the world.
Explore Retrace's product features to learn more.
If you would like to be a guest contributor to the Stackify blog please reach out to stackify@stackify.com