By TechnologyAzure and AWS Monitoring
By IndustryIntegrates with your stack
By InitiativeEngineering & DevOps Teams
TechnicalIt’s easy to get the help you need

Every application has specific functions that are mission critical. Including things like a customer’s ability to purchase something on your website or a REST API that handles thousands of requests per minute. Identifying and closely monitoring these key website transactions is a good best practice.
Retrace enables deep performance monitoring of applications. You can monitor the overall performance of your entire application or specific web transactions. Please note that Retrace works well with web applications and background services.
By default, Retrace automatically tracks the overall performance of your application. Since Retrace works via lightweight code profiling, it is aware of every request to your application and all exceptions that are thrown. This data can be used to track 6 stats about your overall application performance.


Previously, we highlighted the key stats that Retrace can monitor in regards to overall application performance. You can also monitor individual web transactions.
You can track and monitor Avg page load time, HTTP Error %, Requests per minute, and the Satisfaction score.
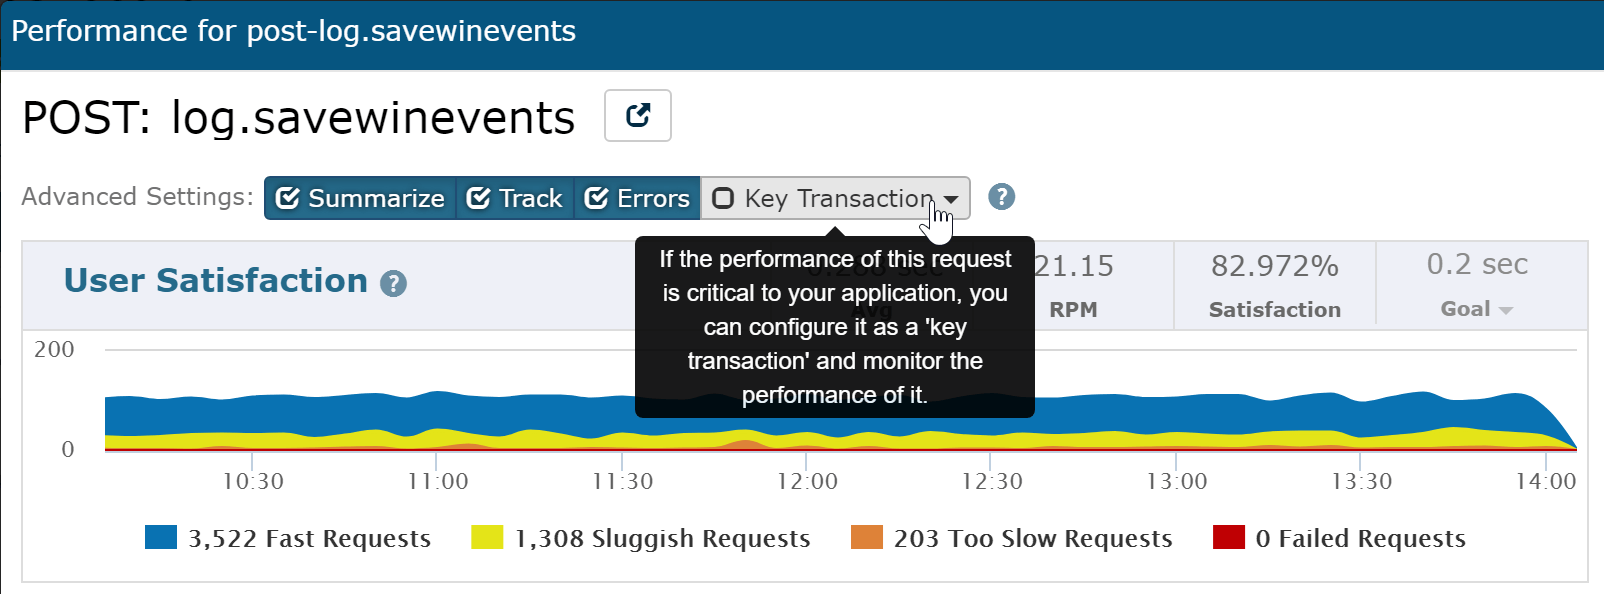
This example below is from one of our test environments. This specific request handles log data being sent to us and is extremely high volume in production. For us, this is a good example of a mission critical type of web transaction to monitor closely.

Retrace automatically captures all web requests. To begin monitoring it as a key transaction, select the web transaction and from the dialog click “Key Transaction”.

You can configure different thresholds for how you would like monitoring alerts to be handled. You can also configure which notifications groups should be notified in the event of an alert.
In this example below, you can even see how you could setup an alert if request volume was oddly low (< 100 in this example).

Retrace automatically tracks all SQL queries that are executed by your application. Dynamic SQL parameters are removed, and we do our best to identify SQL queries uniquely. You can then configure monitors for SQL queries.
This is done similarly as it is for key web transactions. Select the SQL query and then click “Key Transaction”.

Note: Retrace has two ways to monitor SQL queries. In this example, we are showing how we can monitor the volume and an average duration of queries being executed by your code. Retrace also has the ability to execute a SQL query and you can monitor the results of that specific query. Learn more: SQL Monitoring
APM solutions like Retrace allow you to monitor how often a specific web transaction occurs, how long it takes, and what it is doing at the code level. You can also use scheduled HTTP checks to track how long a request takes from the caller side.
Retrace can perform HTTP checks from our data center or from one of your servers. You can use them to monitor response times, status codes, and even look for specific content. We use them at Stackify to monitor Elasticsearch for specific things.

One of the advanced features of Retrace is what we called “Tracked Functions.” It provides a way to track how often a specific piece of code is called within a web transaction. This can be used to essentially monitoring the performance of pieces of a larger web transaction.
Why would someone use Tracked Functions?
As one example, we use them internally at Stackify to track Elasticsearch queries. Via the code profiling that Retrace does, it knows about Elasticsearch queries, but it doesn’t currently provide any reporting per query or type of query. By adding a couple of lines of code to our app, we are now able to get visibility into how often we call specific types of Elasticsearch queries and how long they take.
For example, our code looks something like this below. By using StackifyLib, we can add in the tracked functions.
Task<ElasticsearchResponse> SearchAsync(string index, string type, object body)
{
	var tracer = StackifyLib.ProfileTracer.CreateAsTrackedFunction("ES: " + queryName);
	return tracer.ExecAsync<ElasticsearchResponse>(() =>
	{
		//execute the query
	}
}
Tracked Functions are supported in .NET and Java both. Please see our docs for more info.
Depending on what you are trying to monitor about your application, you should also be aware of our extensive support for monitoring application metrics.
With Retrace, you can monitor things like CPU % and Memory but also more advanced metrics around garbage collection, error rates, and much more. Retrace supports JMX, Windows Performance Counters as well as metrics created via our API.
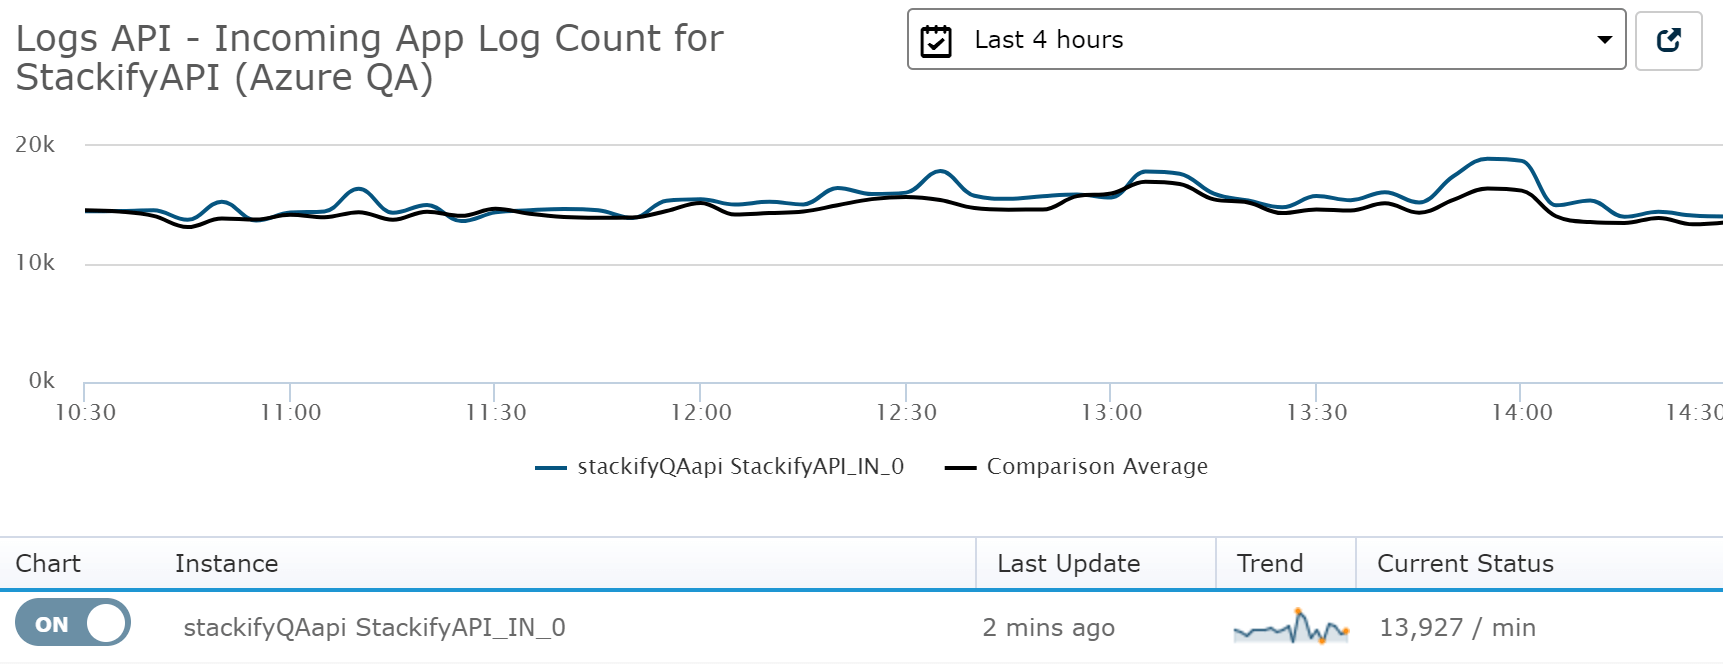
For example, at Stackify we use custom metrics to track some performance and usage stats around Redis. This is an example of custom metrics that apply across an entire application.

Since Retrace tracks all of the metrics per application instance, you can also quickly compare these metrics across instances.

Custom metrics can be really powerful for monitoring specific web transactions as well. For example, we use them to know how many log messages per minute are being processed within our application. We can monitor that for spikes or erratic traffic loads. Custom metrics can be very helpful for web transaction monitoring.

Learn more about Custom Metrics in our docs.
Another good way to monitor key business transactions or web requests is by monitoring the application logs. Many applications write information to their logs that can be useful signals for potential application problems.
Searching through error and log data also allows you to get access to information that is not available any other way.
At Stackify, we have a log monitor setup to search for “Cannot open server requested by the login Client with IP address” every minute and send us an alert if it finds it for 5 minutes in a row. This specific message occurs when SQL Azure is refusing connections due to their firewall.
Part of our nightly process does a backup of Elasticsearch data. We have a log monitor setup to look for a specific message that denotes that the backup was completed. Our log monitor actually looks for if the log messages were not found. If it was not found, that is a critical problem.
Retrace is designed to provide developers detailed and easy to use application monitoring. As you can see in this article, Retrace makes it easy to monitor the overall performance of your application, a specific web transaction, or even a SQL query. You can also get more advanced and use tracked functions, custom metrics, and log monitoring to get really granular. Retrace is an excellent solution for advanced web transaction monitoring.
Stackify's APM tools are used by thousands of .NET, Java, PHP, Node.js, Python, & Ruby developers all over the world.
Explore Retrace's product features to learn more.
If you would like to be a guest contributor to the Stackify blog please reach out to stackify@stackify.com