By TechnologyAzure and AWS Monitoring
By IndustryIntegrates with your stack
By InitiativeEngineering & DevOps Teams
TechnicalIt’s easy to get the help you need

Serilog is a newer logging framework for .NET. It was built with structured logging in mind. It makes it easy to record custom object properties and even output your logs to JSON.
Note: You can actually check out our other tutorials for NLog and log4net to learn how to do structured logging with them also!
In this article, we are going to review some of the key features, benefits, and best practices of Serilog.
Logging is one of the most basic things that every application needs. It is fundamental to troubleshoot any application problems.
Logging frameworks make it easy to send your logs to different places via simple configurations. Serilog uses what are called sinks to send your logs to a text file, database, or log management solutions, or potentially dozens of other places, all without changing your code.
Starting with Serilog is as easy as installing a Serilog Nuget package. You will also want to pick some logging sinks to direct where your log messages should go, including the console and a text file.
If you are new to Serilog, check out their website: Serilog.net
Install-Package Serilog
Install-Package Serilog.Sinks.Console
Sinks are how you direct where you want your logs sent. The most popular of the standard sinks are the File and Console targets. I would also try the Debug sink if you want to see your log statements in the Visual Studio Debug window so you don’t have to open a log file.
Serilog’s sinks are configured in code when your application first starts. Here is an example:
using (var log = new LoggerConfiguration()
    .WriteTo.Console()
    .CreateLogger())
{
    log.Information("Hello, Serilog!");
    log.Warning("Goodbye, Serilog.")
}
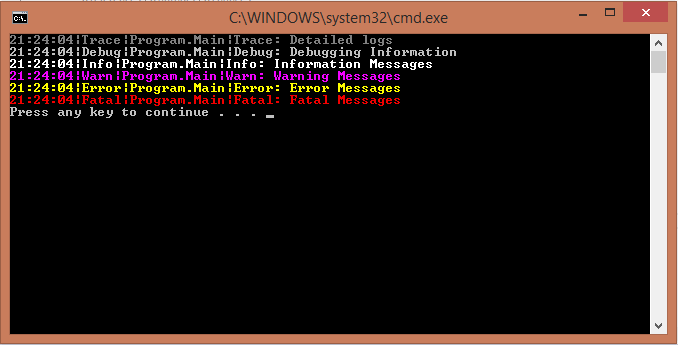
If you are using a Console, you should check out the ColoredConsole sink:

If you are having any problems with Serilog, you can subscribe to it’s internal events and write them to your debug window or a console.
Serilog.Debugging.SelfLog.Enable(msg => Debug.WriteLine(msg));
Serilog.Debugging.SelfLog.Enable(Console.Error);
Please note that the internal logging will not write to any user-defined sinks.
Be sure to use verbose, debug, information, warning, error, and fatal logging levels as appropriate.
This is really valuable if you want to specify only certain levels to be logged to specific logging sinks or to reduce logging in production.
If you are using a central logging solution, you can easily search for logs by the logging level. This makes it easy to find warnings, errors, and fatals quickly.
When Serilog was first released, this was one of the biggest reasons to use it. It was designed to easily log variables in your code.
As you can see in his example, it is easy to use these custom variables:
Log.Debug("Processing item {ItemNumber} of {ItemCount}", itemNumber, itemCount);
Serilog takes it to the next level because those same variables can also easily be recorded as JSON or sent to a log management solution like Retrace.
If you want to really get the value of structured logging, you will want to send your logs to a log management tool that can index all the fields and enable powerful searching and analytics capabilities.
Warning: Saving logs to a database doesn't scale
Querying a SQL database for logging data is a terrible idea if aren’t using full-text indexing. It is also an expensive place to save logging data.
You are much better off sending your logs to a log management service that can provide full-text indexing and more functionality with your logs.
Everyone has made this mistake only once. Sending an email every time an exception happens quickly leads to all the emails being ignored, or your inbox gets flooded when a spike in errors occurs.
If you love getting flooded with emails, there is an email sink you can use.
If you want to send alerts when a new exception occurs, send your exceptions to an error reporting solution, like Stackify Retrace, that is designed for this. Retrace can deduplicate your errors so you can figure out when an error is truly new or regressed. You can also track its history, error rates, and a bunch of other cool things.
Capturing logs and logging them to a file on disk is great, but it doesn’t scale and isn’t practical on large apps. If you want to search your logs across multiple servers and applications, you need to send all of your logs to a centralized logging server.
You can easily send your logs to Stackify with our custom sink:
var log = new LoggerConfiguration()
    .WriteTo.Stackify()
    .CreateLogger();
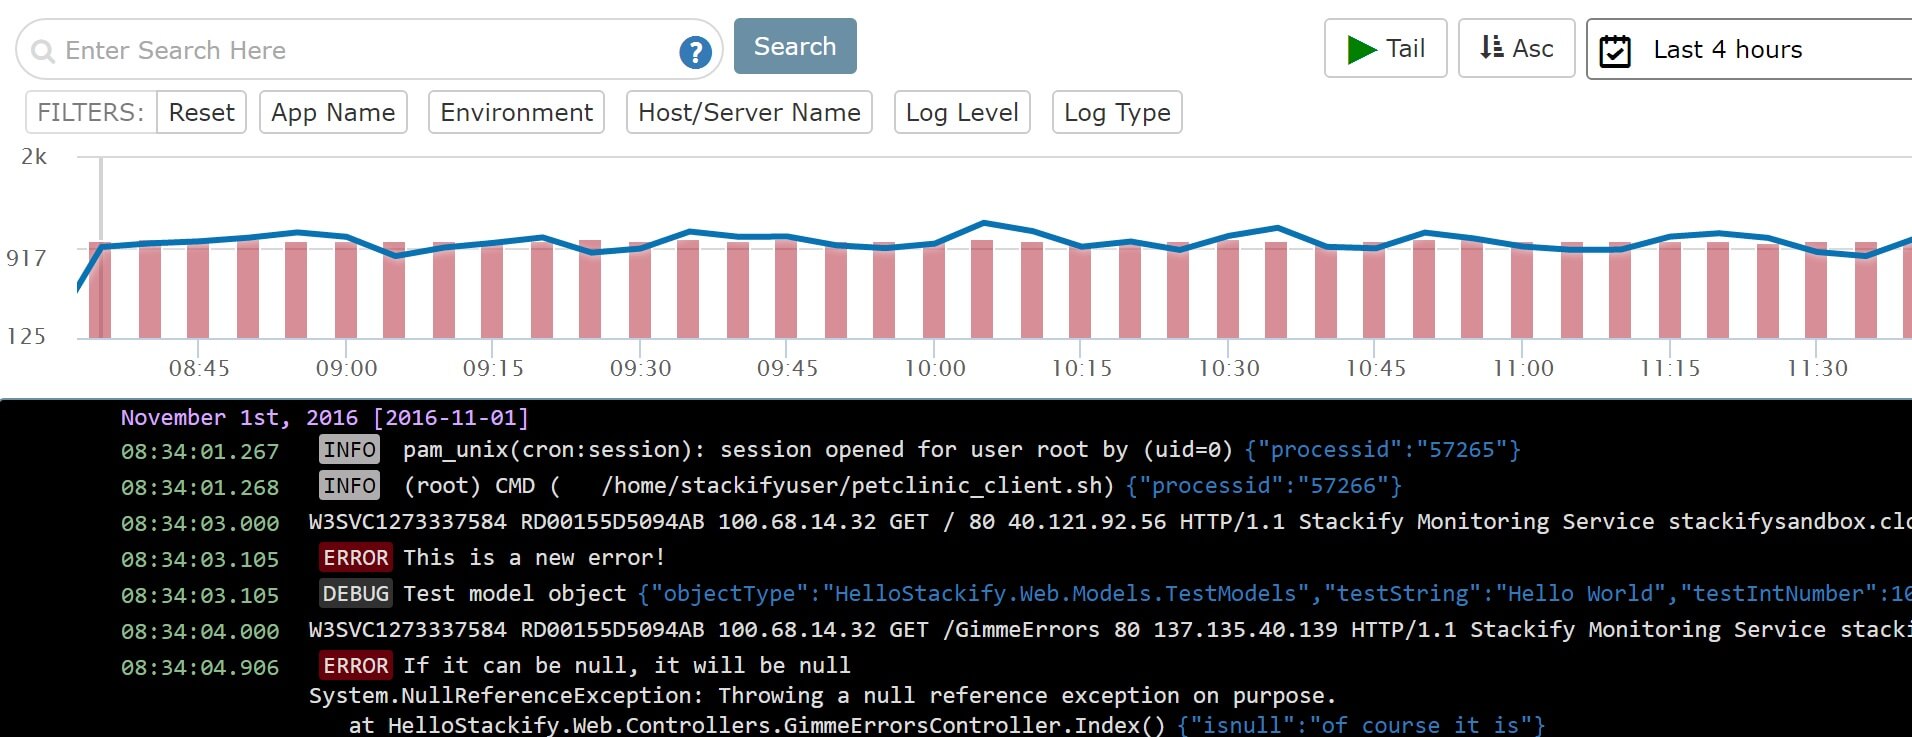
Products like Stackify Retrace make it easy to view all of your logs in one place and search across all of them. They also support things like log monitoring, alerts, structured logging, and much more.
Screenshot of Retrace’s log viewer:

Serilog has the ability to specify log levels to send to specific sinks or suppress all log messages. Use the restrictedToMinimumLevel parameter.
Log.Logger = new LoggerConfiguration()
    .MinimumLevel.Debug()
    .WriteTo.File("log.txt")
    .WriteTo.Console(restrictedToMinimumLevel: LogEventLevel.Information)
    .CreateLogger();
If you want to do something that the standard Serilog sinks do not support, you can search online for one or write your own.
One example could be a target for writing to Azure Storage.
As an example of a custom target, you can review the source code for our Serilog sink for sending logs to Retrace.
With Serilog you can control the format of your logs, such as which fields you include, their order, and etc.
Here is a simple example:
Log.Logger = new LoggerConfiguration()
    .WriteTo.Console(outputTemplate:
        "[{Timestamp:HH:mm:ss} {Level:u3}] {Message:lj}{NewLine}{Exception}")
    .CreateLogger();
The following fields can be used in a custom output template:
If that isn’t enough, you can implement ITextFormatter to have even more control of the output format.
Serilog has also great support from writing your log files as JSON. It has a built-in JSON formatter that you can use.
Log.Logger = new LoggerConfiguration()
    .WriteTo.File(new CompactJsonFormatter(), "log.txt")
    .CreateLogger();
Most logging frameworks provide some way to log additional context values across all logging statements. This is perfect for setting something like a UserId at the beginning for a request and having it included in every log statement.
Serilog implements this by what they call enrichment.
Below is a simple example of how to add the current thread id to the logging data captured.
var log = new LoggerConfiguration()
    .Enrich.WithThreadId()
    .WriteTo.Console()
    .CreateLogger();
To really use enrichment with your own app, you will want to use the LogContext.
var log = new LoggerConfiguration()
    .Enrich.FromLogContext()
After configuring the log context, you can then use it to push properties into the context of the request. Here is an example:
log.Information("No contextual properties");
using (LogContext.PushProperty("A", 1))
{
    log.Information("Carries property A = 1");
    using (LogContext.PushProperty("A", 2))
    using (LogContext.PushProperty("B", 1))
    {
        log.Information("Carries A = 2 and B = 1");
    }
    log.Information("Carries property A = 1, again");
}
One of the toughest things about logging is correlating multiple log messages to the same web request. This is especially hard in async code.
You can use one of the enrichment libraries to add various ASP.NET values to each of your log messages.
var log = new LoggerConfiguration()
    .WriteTo.Console()
    .Enrich.WithHttpRequestId()
    .Enrich.WithUserName()
    .CreateLogger();
It also has some cool options to add things like WithHttpRequestRawUrl, WithHttpRequestClientHostIP, and other properties.
If you are using .NET full framework or .NET Core, check out these enrichment libraries:
Note: There are also some other enrichment libraries for other various ASP.NET frameworks.
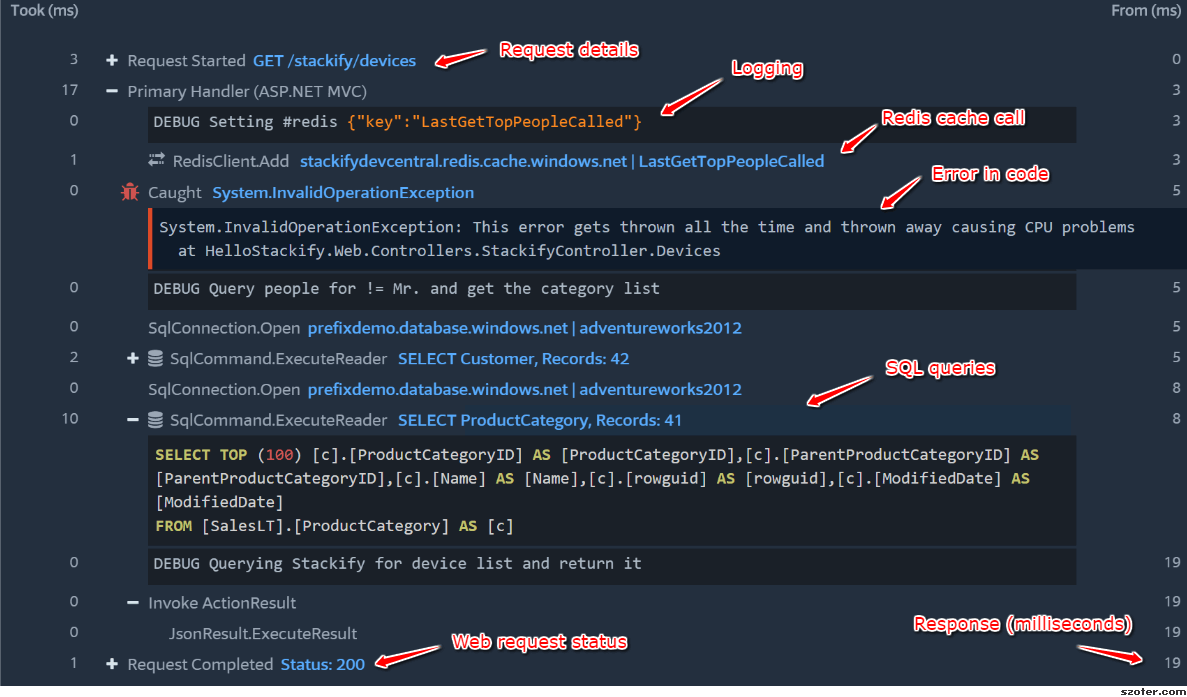
Log files can quickly become a spaghetti mess of log messages. Especially with web apps that have lots of AJAX requests going on that all do logging.
I highly recommend using Prefix, Stackify’s free .NET Profiler to view your logs per web request along with SQL queries, HTTP calls, and much more.

In this tutorial about Serilog, we covered best practices, benefits, and features of Serilog that you should know about. We also showed you how can use Stackify Prefix (for free) to view your logs while testing your application on your development machine. We also briefly showed the power of Stackify Retrace for centralizing all of your logs in one easy to use log management solution.
Stackify's APM tools are used by thousands of .NET, Java, PHP, Node.js, Python, & Ruby developers all over the world.
Explore Retrace's product features to learn more.
If you would like to be a guest contributor to the Stackify blog please reach out to stackify@stackify.com