Stackify is now BMC. Read theBlog

Get The Whole Story From Your Code

Being to able to see what your code is doing along with your application logging is like the holy grail for developers.

Lightweight Code Profiling

Retrace tracks only the key methods in your code and is safe for production usage

Automatic Instrumentation

Standard application frameworks and dependencies are all supported automatically

Deep Performance Insights

Retrace collects detailed snapshots of what your code is doing and how long it takes

Experience Our Tracing On Your Workstation For Free

Stackify’s powerful code profiling is the heart of Retrace and Prefix. Our goal is to make it easy for to improve your code’s performance.

Stackify’s powerful code profiling is the heart of Retrace and Prefix. Our goal is to make it easy for to improve your code’s performance.

Prefix is the world’s best dynamic code analysis tool. Prefix also happens to be the world’s only dynamic code analysis tool, but whatevs. Think of it like a lightweight web request profiler built to help developers never say things like “well, it worked on my machine,” ever again.

Prefix’s dynamic code analysis reduces dreaded code churn by validating the behavior of your code with detailed code-level traces, logs by request, hidden exceptions, and SQL query monitoring.

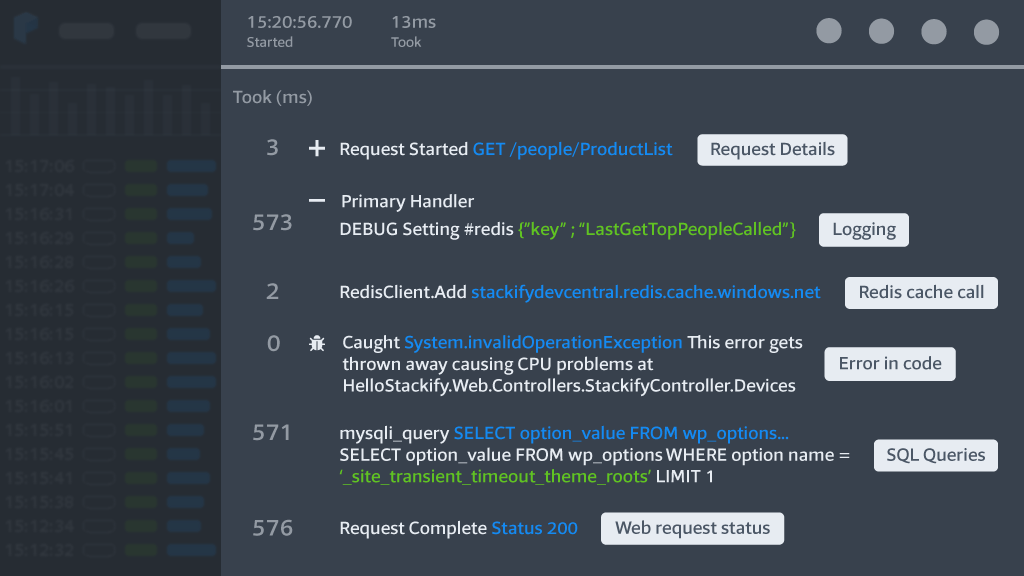
Get Detailed Snapshots of What Your Code Is Doing

Bring code profiling and logging together with Retrace and get the whole story behind your application’s performance.

  • Web request details
  • View logging and errors
  • SQL queries
  • HTTP calls
  • Plus dozens of other dependencies

Advanced Features

  • Support for non-web-applications
  • Track custom methods in your code

View Complete SQL Details

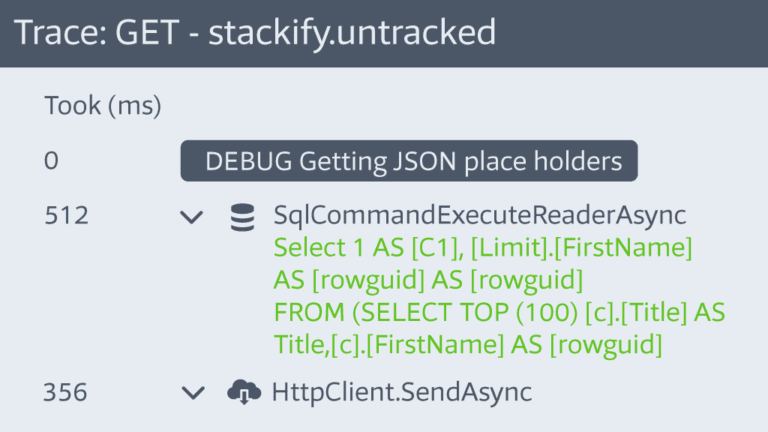
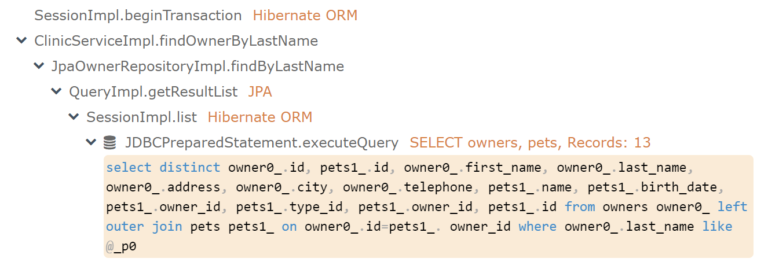
Retrace tracks every SQL query executed by your code. This includes how long they takes as well as other key details.

  • Full SQL statement
  • Database server and name
  • Number of records affected
  • Transaction usage

Track External HTTP Calls

Most applications leverage multiple external web services. Retrace will automatically track the usage and performance anywhere your code makes HTTP Requests. Virtually all types of HTTP requests are automatically supported.

  • External web services
  • Libraries that internally use HTTP like Elasticsearch
  • SOAP or REST APIs
  • HTTP based microservices

See What Your Async Code Is Doing

Profiling and understanding the performance of async code can be very complicated. Retrace supports modern async development patterns for .NET and Java.

  • .NET async/await
  • Java concurrent
  • Java threads

Automatic Instrumentation for Your Stack

Retrace works out of the box with your .NET, PHP, Node.js, Ruby, Python, and Java stack, and dozens of common frameworks are supported, including:

  • SQL Server, Oracle, PostgreSQL, MySQL
  • MongoDB
  • Elasticsearch
  • Redis
  • AWS, Azure

Don't Get Left in the Dark

Get Started with Retrace Today.