
By TechnologyAzure and AWS Monitoring
By IndustryIntegrates with your stack
By InitiativeEngineering & DevOps Teams
TechnicalIt’s easy to get the help you need

Tracing bugs in your PHP code can be very time-consuming. In order to find bugs quickly in your PHP applications, you can use PHP tracing tools. Stackify provides two tools, Retrace & Prefix, which can help with tracing what happens within a web request or transaction.
Retrace is a very affordable application performance monitoring solution that provides centralized logging, error tracking, application metrics, code profiling, and deployment tracking of your applications.
Here are some tips on how to trace your PHP applications with Retrace.
To get started, you want to make sure you have installed Retrace on your server. If you do not currently use Retrace, you can sign up for a free trial and give it a try!
Retrace is installed on your server and then you need to enable our PHP extension to fully enable Retrace’s advanced PHP tracing capabilities. Installation takes just a few minutes.
Please review our support documents to learn how to install Retrace for PHP.
Retrace is designed to automatically trace key methods in your code. This includes standard application frameworks and dependencies. We all know that finding and fixing bugs in production is complex and tiring. Retrace offers lightweight application profiling that is safe for production usage and can detect errors and problems at the code level.
Some of the frameworks supported by Retrace:
View a complete list of supported frameworks in our documentation.
Example of a PHP profiling trace collected by Retrace:
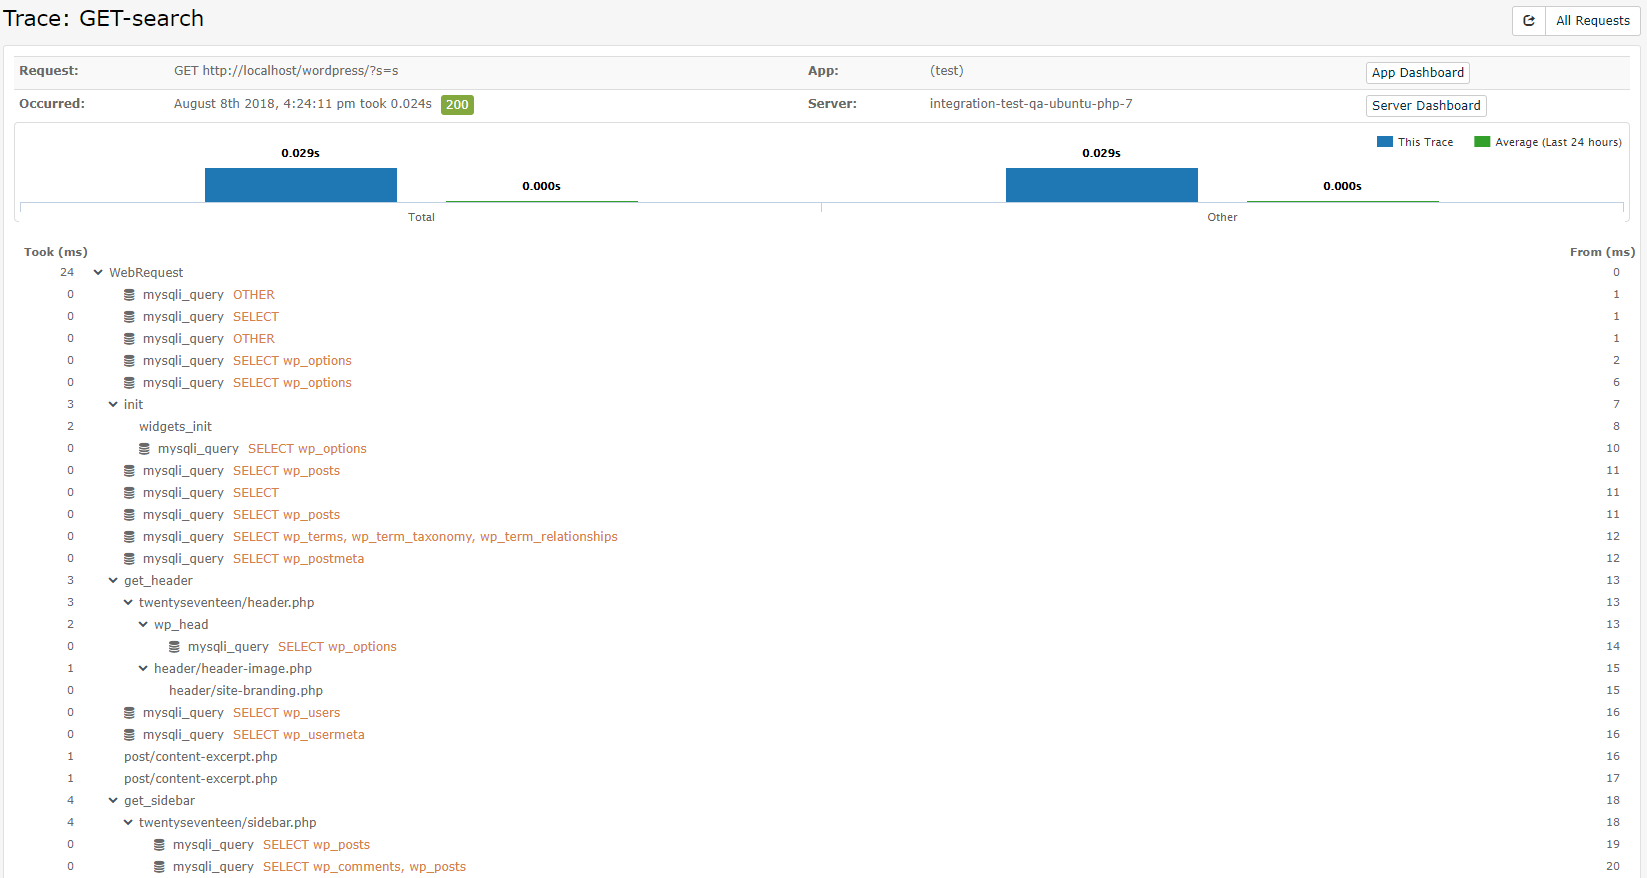
Retrace can help you improve the performance of your application.
Retrace provides application performance monitoring that highlights the importance of your code. In the screenshot below, Retrace allows you to quickly see how your application is performing. You can view specific PHP traces captured by our PHP profiler.
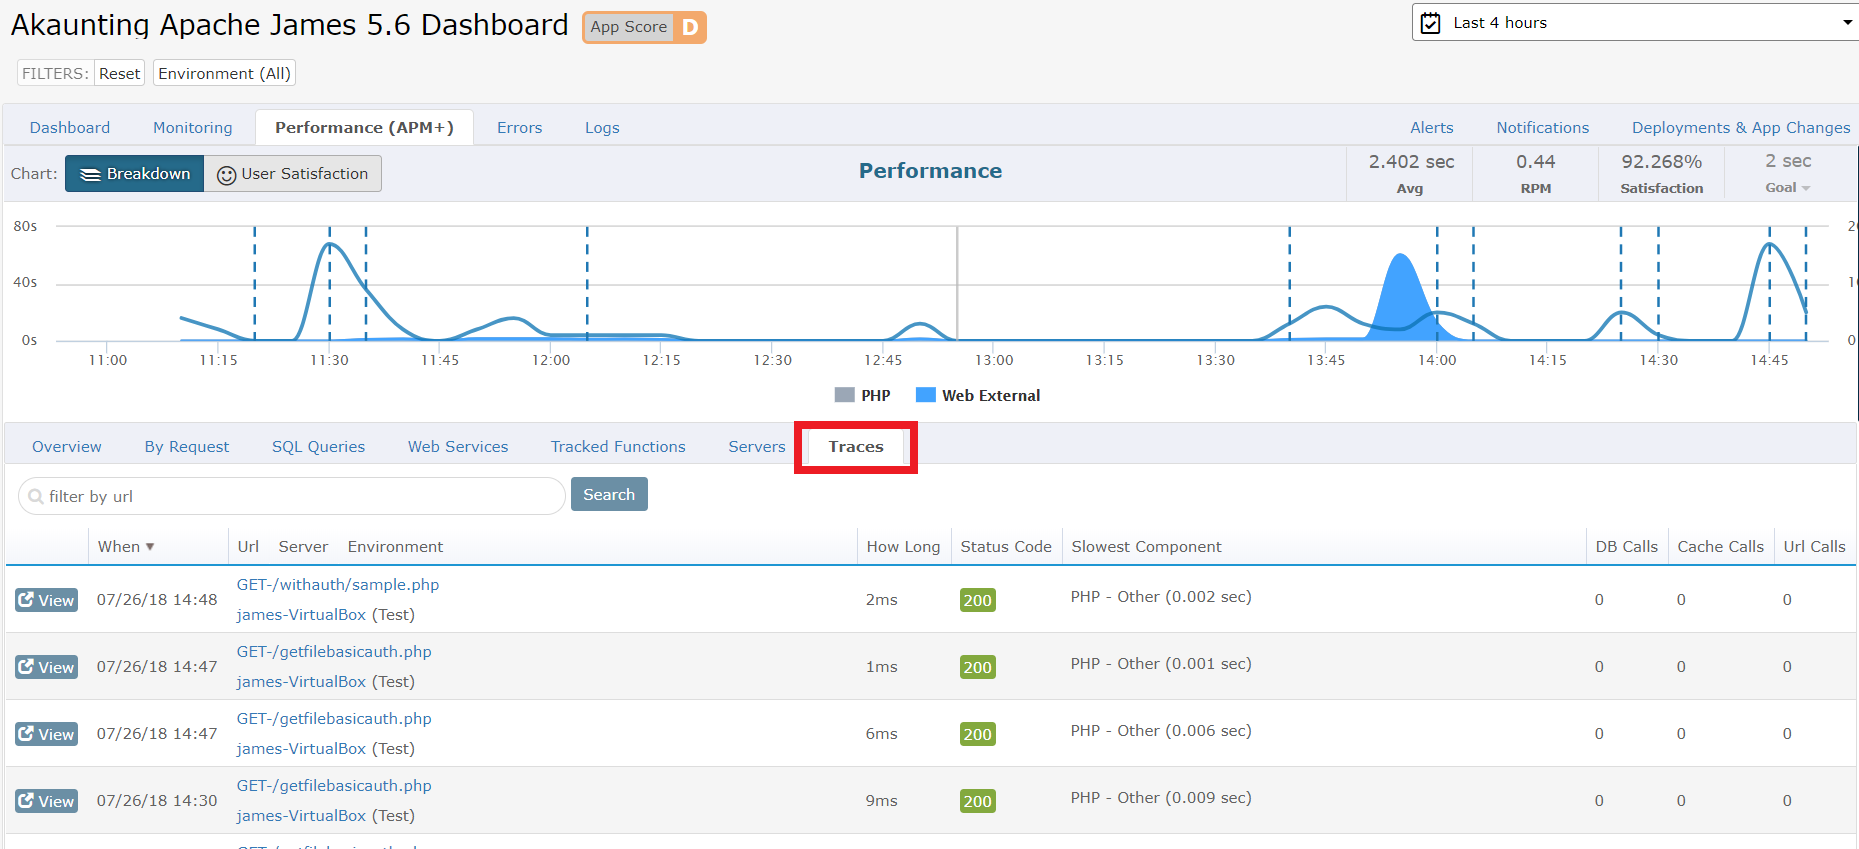
The combination of Retrace code profiling and your application logs makes troubleshooting complex problems much easier. With Retrace, you can use Monolog or log4php logging frameworks to send all of your application logs to Retrace. There are specific configurations for every framework plugin that you might use and it can be found in the Stackify GitHub page.
With Retrace, your logs can be viewed in App Dashboard for your PHP application. Retrace provides advanced error tracking and centralized logging features. Below is a screenshot of the Retrace log viewer.
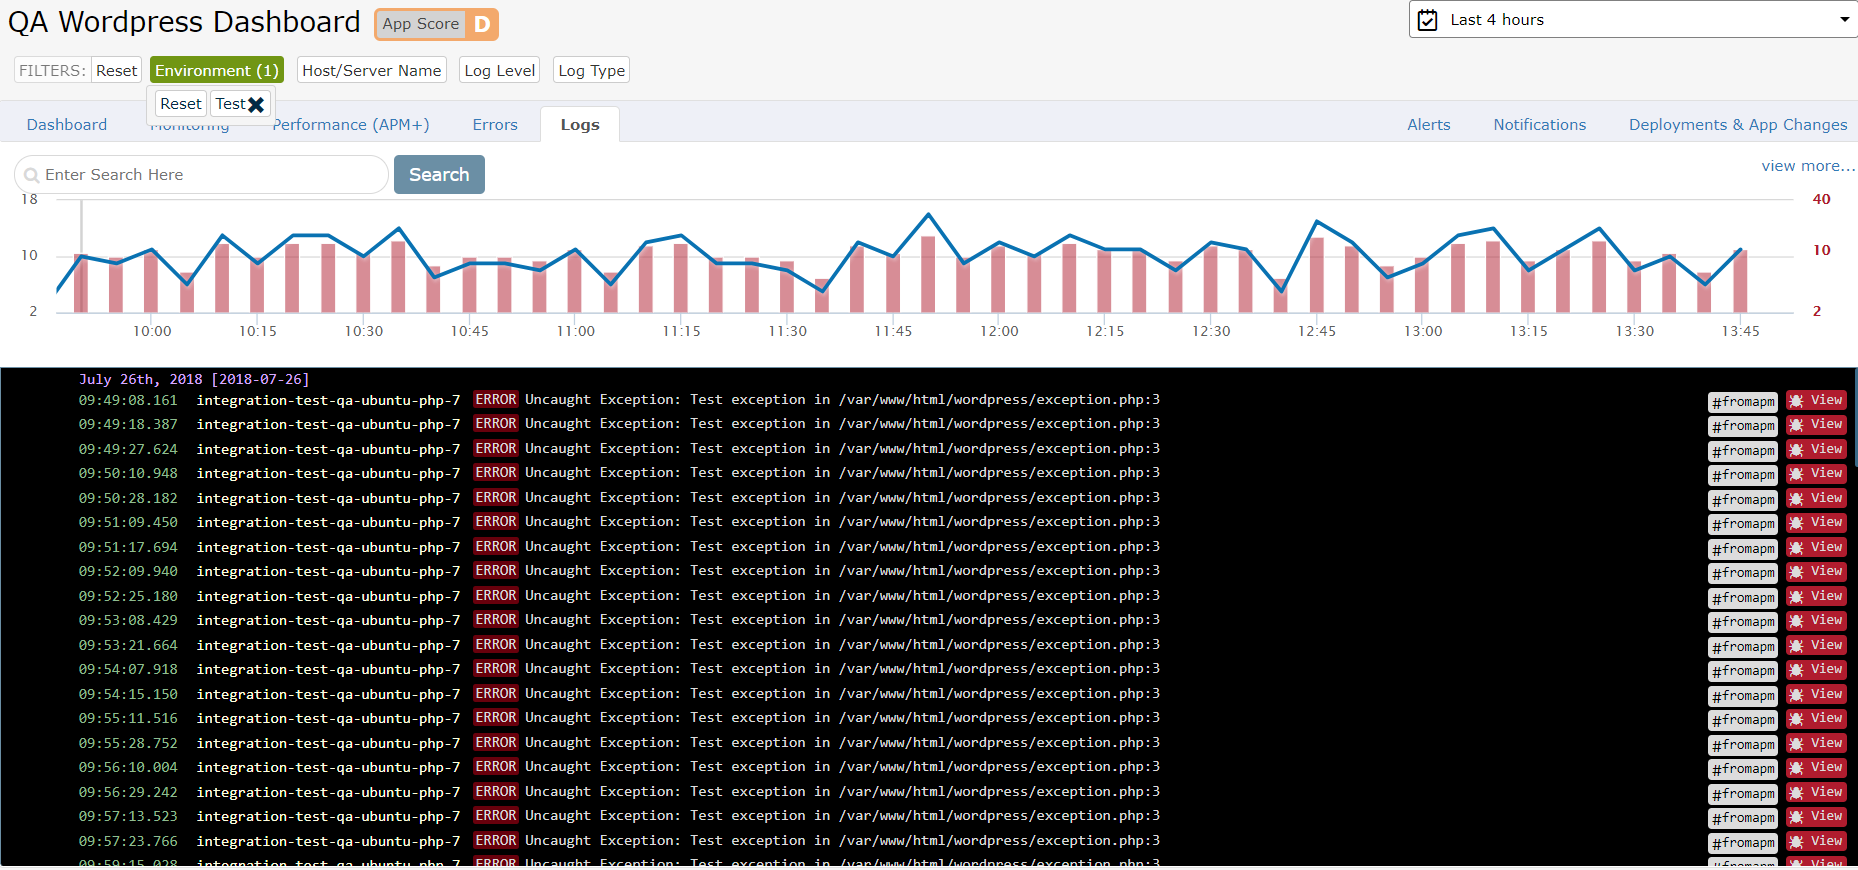
Other logging libraries include the following:
Retrace tracks every SQL query executed by your code. This includes the full SQL statement, database server, and number of records affected.
Retrace provides dashboards to show you how all of your SQL queries are performing. Within the PHP trace view, you can also see the individual SQL queries being called for a specific web request.
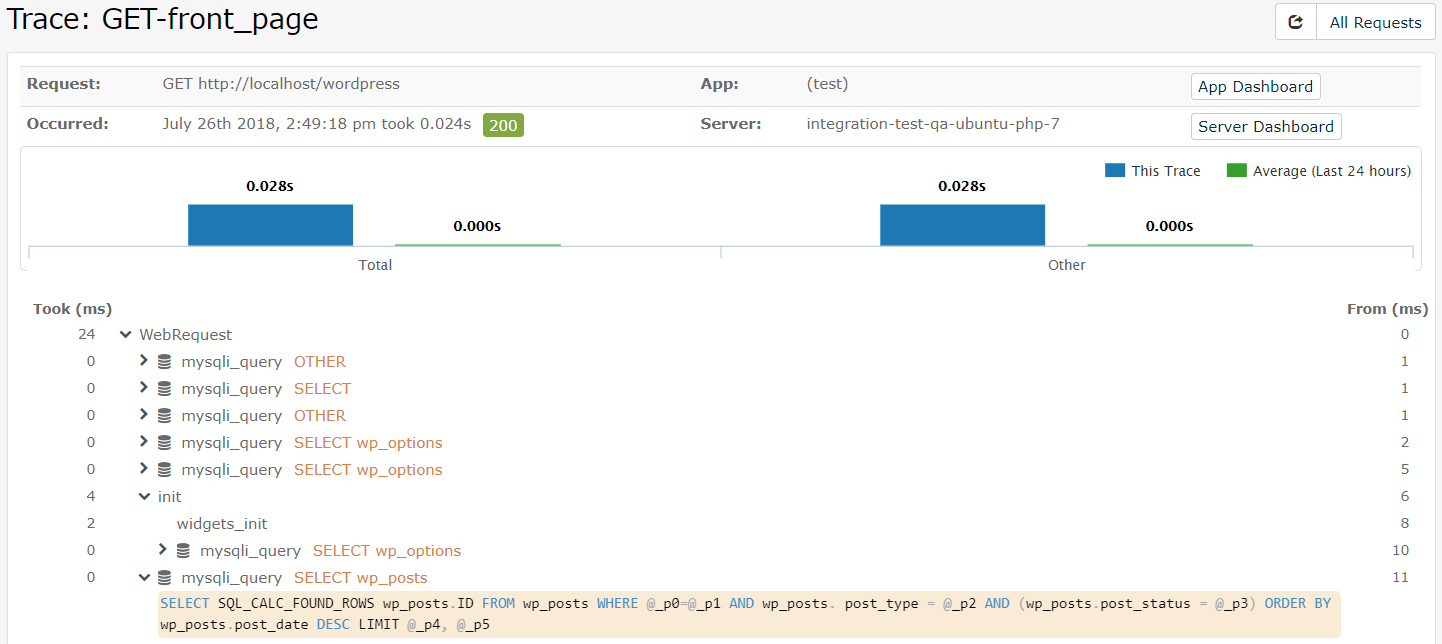
Retrace can automatically collect exceptions being thrown by your code. This makes it easy to identify errors that are occurring that could be impacting your users or performance of the system.
You can also report errors to Retrace via logging frameworks like Monolog. Being able to view all of the errors in your code makes it easier to track down issues in your PHP applications.
Errors can be seen for just a specific application or across all applications. Retrace is especially useful for finding new errors that happen just after a new deployment of your software.
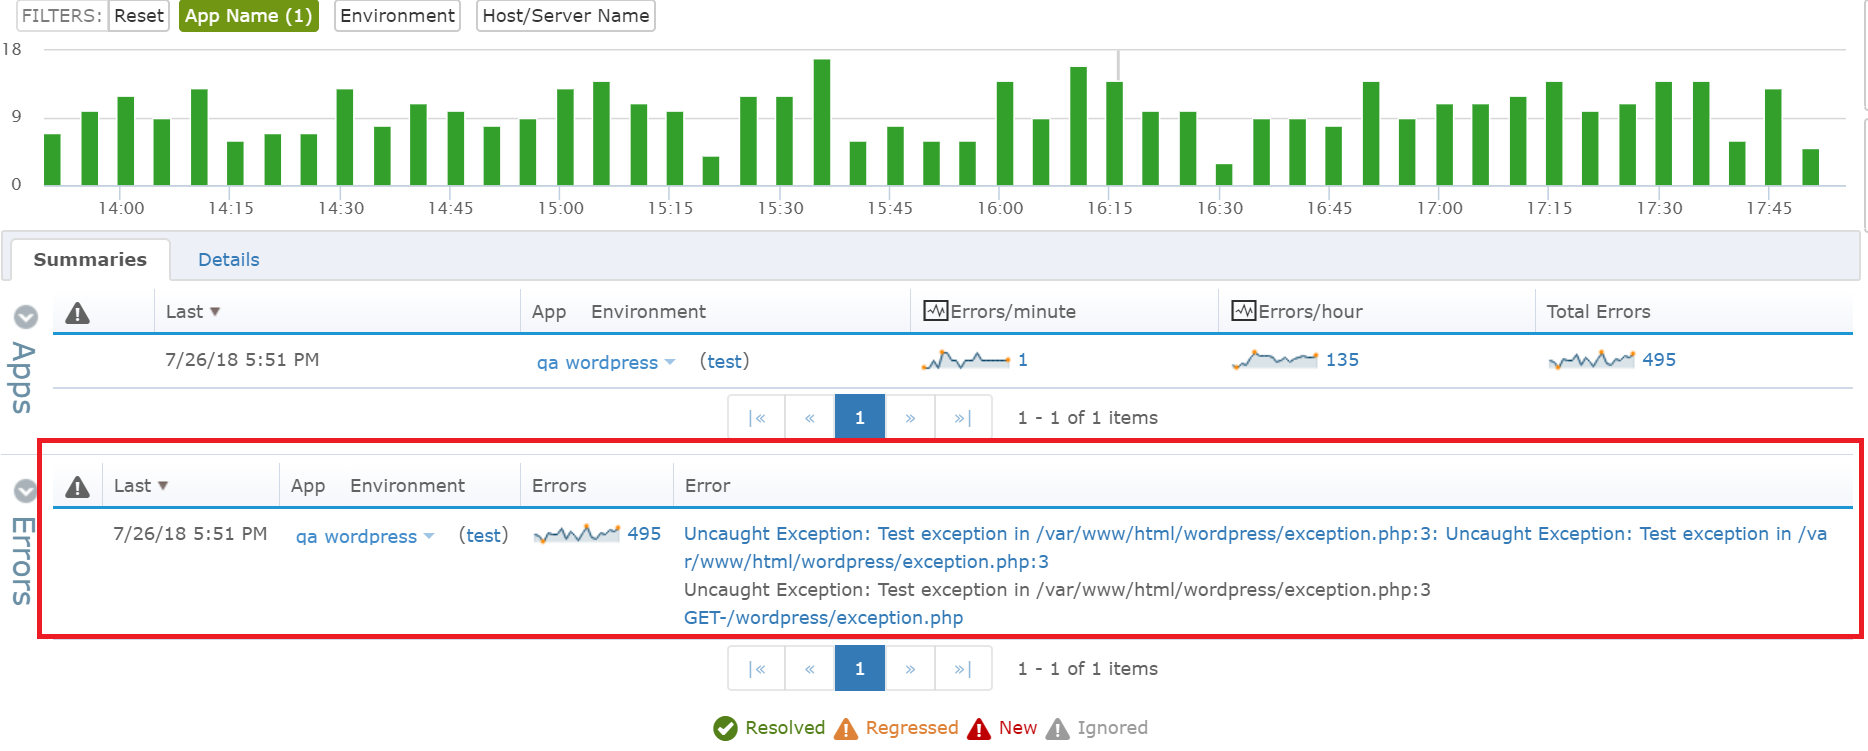
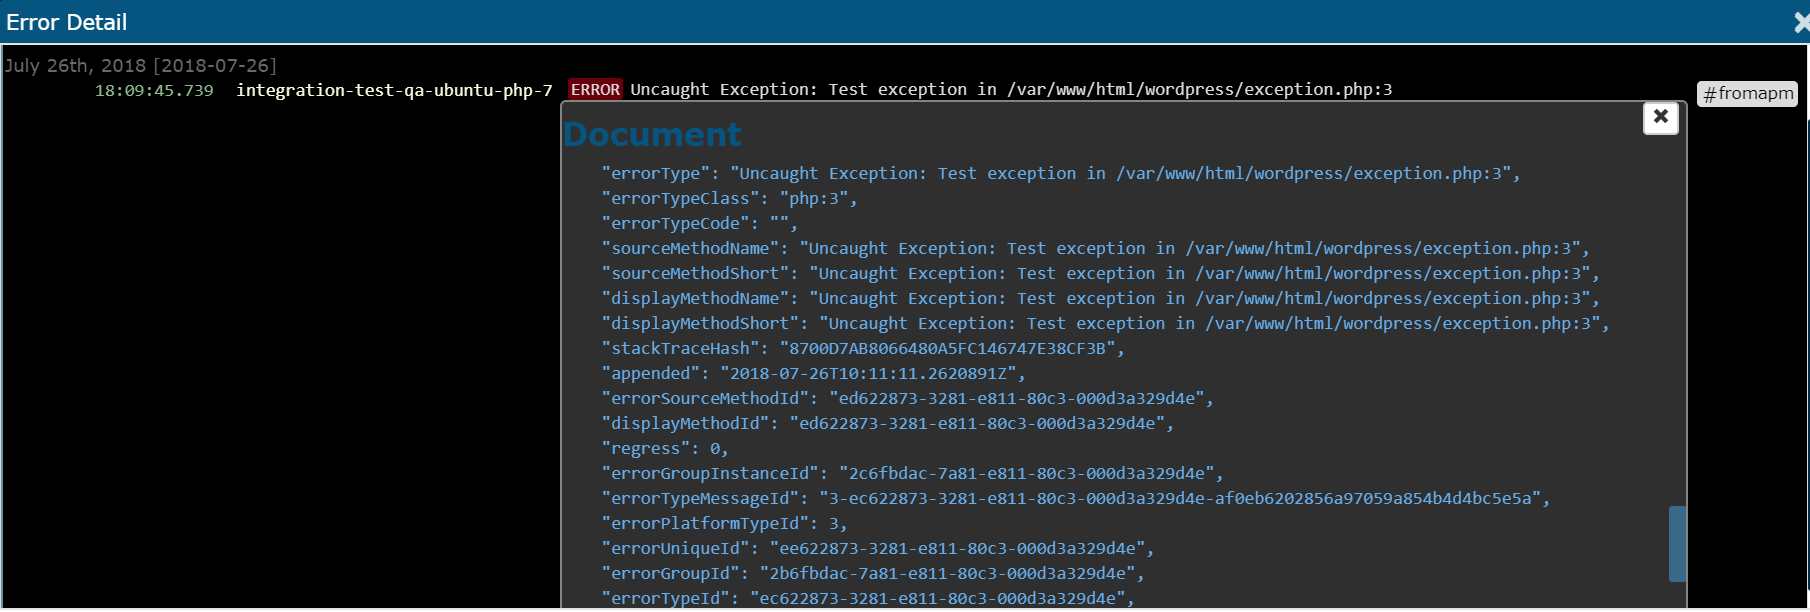
Below is a sample error detail screen in Retrace. You can view the URL, full stack trace, headers, and other important information. This provides more context about the error that occurred.

PHP tracing tools are very valuable for quickly finding bugs and ways to improve your application code. Retrace is a powerful tool for tracing the performance of your PHP applications all the way down to the code level.
Sign up for a free trial and start Retrace today!
These articles provide additional information about performance tuning that might be useful for your PHP applications.
Stackify's APM tools are used by thousands of .NET, Java, PHP, Node.js, Python, & Ruby developers all over the world.
Explore Retrace's product features to learn more.
If you would like to be a guest contributor to the Stackify blog please reach out to stackify@stackify.com