By TechnologyAzure and AWS Monitoring
By IndustryIntegrates with your stack
By InitiativeEngineering & DevOps Teams
TechnicalIt’s easy to get the help you need

Performance counters are really important for monitoring and troubleshooting problems with your .NET applications. The full .NET Framework provides a wide array of performance counters that are very useful for troubleshooting application problems.
Some examples of important performance counters are garbage collection and exception rates. Without these, you will be flying blind.
In this article we will discuss how to use performance counters with .NET Core, an alternative to these performance counters, and Microsoft’s future replacement.
Using performance counters with .NET Core is actually quite easy, if you plan on deploying to Windows. All you need to do is change your application to target the full .NET Framework. The original .NET CLR supports them and makes extensive usage of them. The new Core CLR does not support them since they are not cross-platform. You can use .NET Core and ASP.NET Core with the full .NET Framework on Windows!
If you need support for performance counters, deploying your application to Linux or macOS is not an option. Since Linux or macOS do not have performance counters because they are very much a Windows thing, there is no support for them in apps that target netcoreapp, which is the Core CLR.
If you want to use .NET Core on Windows and have access to performance counters, you can do so by switching your ASP.NET Core web application from targeting netcoreapp20 to net471.
Find your csproj file in Windows Explorer and edit it with a text editor. Change the “TargetFramework” to net471 so it uses the full .NET Framework.
<Project Sdk="Microsoft.NET.Sdk.Web">
   <PropertyGroup>
      <TargetFramework>net471</TargetFramework>
   </PropertyGroup>
   …
</Project>
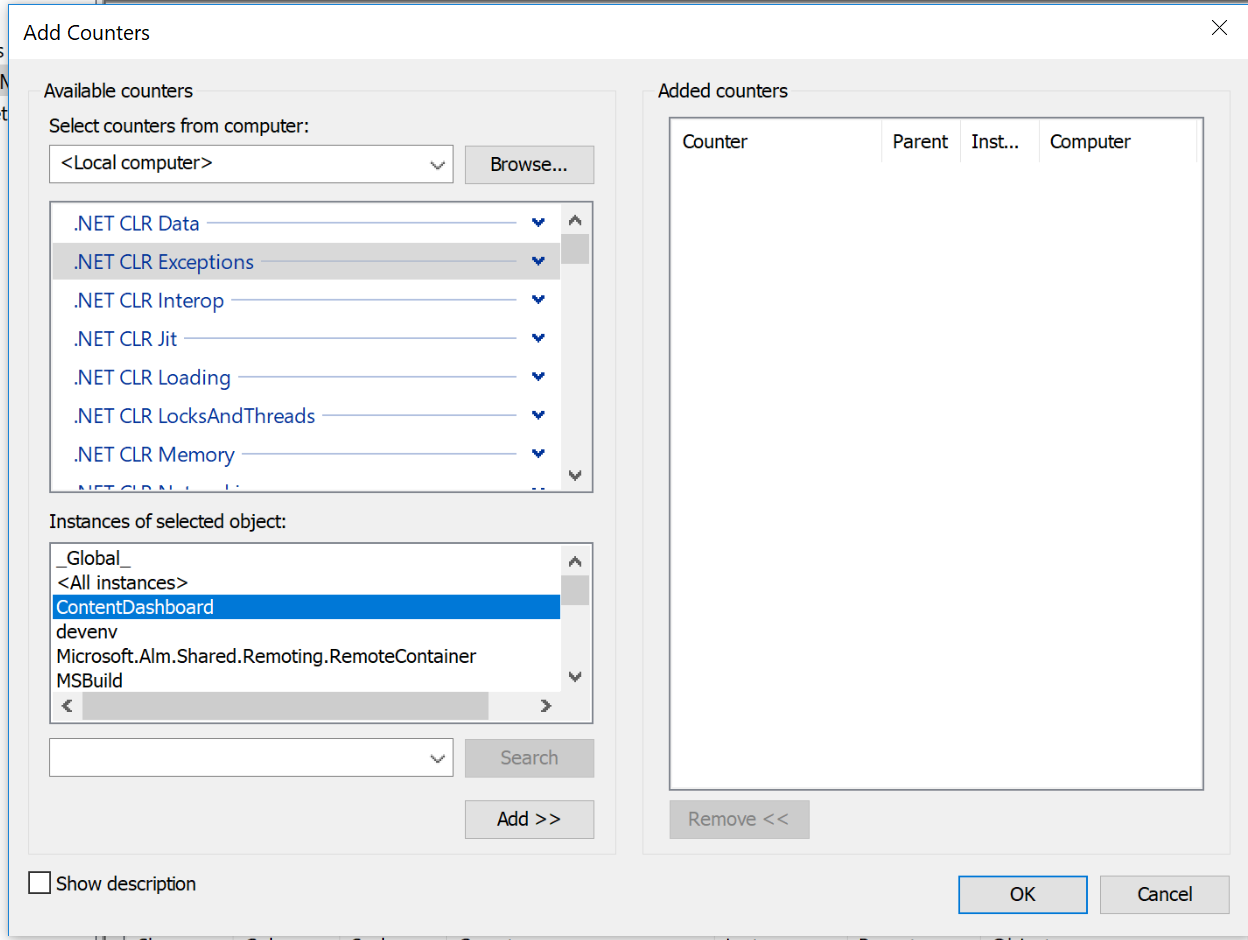
I made the change, published it, and ran my test application, ContentDashboard.exe from Visual Studio. This started the app with the full .NET Framework and the kestrel web server. For my test, you can now see my test app “ContentDashboard” as having performance counters in Windows perfmon below. w00t!

Beyond the built-in metrics that the .NET framework provides, you can also make your own custom performance counters. Unfortunately, if you can’t use performance counters with .NET Core, you also can’t use them for your own custom metrics. Luckily, there are alternative solutions for your own custom metrics!
[adinserter block=”33″]
If you want to use performance counters for your own custom application metrics, you can instead use a 3rd-party library for recording your metrics.
Our product Retrace has excellent support for custom metrics. With just a couple lines of code, you can implement several different types of custom application metrics for your application.
Here is an example of how to report a custom metric to Retrace:
StackifyLib.Metrics.Count(“Logs Processor”, “Incoming App Log Count”, 1);
Your metrics will now show up within Retrace and you can compare the metric across servers, setup alerts, etc.

This is a much simpler solution than using Windows performance counters. They require creating them, reporting data to them, and then configuring your application monitoring system to monitor them. Retrace just does all of that with the one line of code.
Microsoft has so far said that performance counters are not coming to the Core CLR. Instead, a new type of counters called EventCounters are the future.
EventCounters are cross-platform and work on top of EventSource and Event tracing for Windows (ETW). The problem is that they aren’t really in use anywhere and there doesn’t seem to be much tooling in place to use them.
A simple Google search for EventCounters doesn’t even bring up much at all. I’m not sure when they will be available. Perhaps in .NET Core 2.1?
This particular comment on GitHub does a good job of describing them and why Microsoft is going this direction.
Here is one page that shows an example: Introduction Tutorial: How to measure performance for very frequent events using EventCounters
If you want to monitor the performance of your application and troubleshoot things like garbage collection and exception rates, performance counters are critical. For now, the simplest solution is targeting the full .NET Framework and running your application on Windows.
In the future, EventCounters will be able to provide similar types of metrics about the performance of your .NET application from the .NET internals themselves.
In a future article I will try and use EventCounters myself and see if I can get them working! I’d love to see if they show statistics for things like garbage collection, exception rates, etc.
If you are wanting to create your own custom application metrics, a good alternative is using a 3rd-party solution like Retrace.
Stackify's APM tools are used by thousands of .NET, Java, PHP, Node.js, Python, & Ruby developers all over the world.
Explore Retrace's product features to learn more.
If you would like to be a guest contributor to the Stackify blog please reach out to stackify@stackify.com