
By TechnologyAzure and AWS Monitoring
By IndustryIntegrates with your stack
By InitiativeEngineering & DevOps Teams
TechnicalIt’s easy to get the help you need
Over the past few years, I’ve become more and more convinced that having really good production logs is critical to running a successful software deployment. Logging has always been important, however if you’re deploying a web of microservices and a business transaction might span twenty different services, then searchable centralized logging is crucial. There are plenty of great tools available for such logging: Sumo Logic, Log Entries, App Insights, and of course, Stackify’s own Retrace. Querying against logs in one of these tools provides a high-level overview of what’s happening.
However, there is a performance impact from logging. Logging is ideal for events that occur only a few times per second, but scenarios where events occur hundreds of times a second will quickly overwhelm logging services. Frequently we don’t need a detailed log to gather the performance metrics that are important to our application.
Consider people logging into our application: we’re more interested in how many login, rather than who it is. If we typically see 1,000 people a minute logging into the application, but after a deployment the number drops to 500 (or worse to 0), then we know that the deployment has likely introduced a regression. So instead of keeping track of detail logs, we could simply keep a counter of events.
Most people don’t realize that there is a high-performance kernel-level logging and event counting facility built into Windows: Event Tracing for Windows (ETW).
ETW is an ancient system. Many of the articles I read in preparing this post dated back to 2007 (or even 2003). I’m not sure which release of Windows introduced ETW, but Windows 2000 seems like the first operating system referenced in any document. There is a trend these days to dismiss anything that old as silly, and then six months later reinvent it. Fortunately, ETW has continued to be actively developed and there seems to be no movement to replace it.
Writing to it can be enabled or disabled for a process without having to restart the process. This means that it can be turned on for a brief period, and then the logs analyzed at a later date.
ETW is divided into three parts.
Many processes already write events to ETW and allow some debugging without having to even write your own events. There is tight integration with managed .NET applications through instrumentation points in the runtime. The kernel is also a huge provider of event information, as is Internet Explorer or Edge browsers. Of course,you can write to ETW yourself, and we’ll get into that shortly.
Consumers read the stream of events from ETW. You can filter events and either display them, or log them to a file for later use. The PerfView tool is an open source project that can read logs from ETW and display them. It works by capturing a chunk of logs and then presents them for analysis. However, be warned that the amount of data captured can be quite impressive. In the example capture shown below from my my laptop, which had just been rebooted and was running very little, captured 312 MB in 10 seconds.
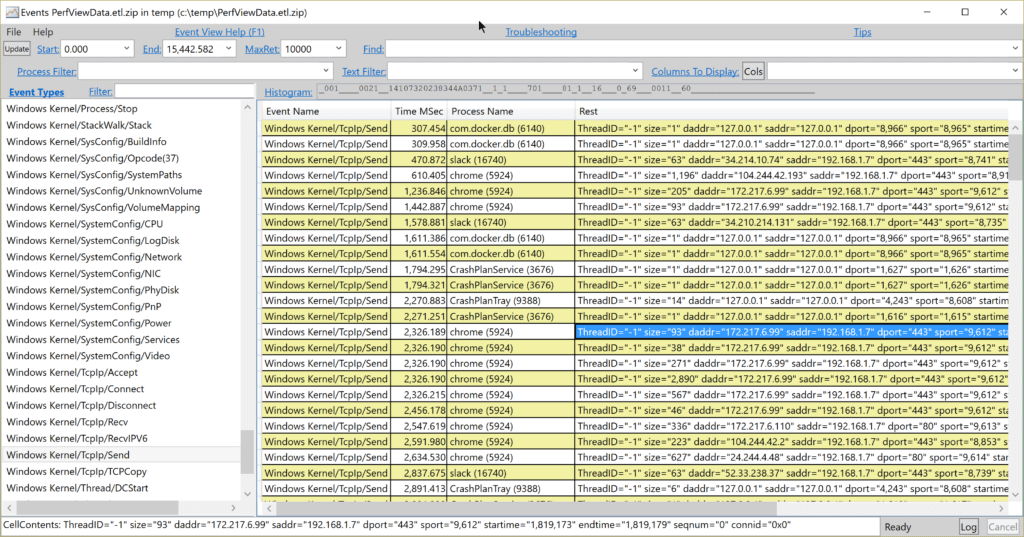
This capture spans all of the event sources on the machine. Notice the variety of applications making use of TCP/IP; because we captured globally, the data spans multiple processes. Fortunately, PerfView allows for some very aggressive filtering so it is possible to isolate a single event source.
Controllers simply turn on the collection of information from a process. During normal operation, most of the event capturing is turned off for every process, and you must explicitly turn it on with a tool like PerfView or Logman. It is important to distinguish ETW from Performance Counters, which are what would be examined by the Performance Monitor tool. While they serve a similar purpose, ETW provides a deeper level of logging; Performance Counters are designed to provide a broader overview of the health of the system. A great explanation of the differences can be found on Stack Overflow.
There are a few consumers of ETW in the wild; one of the better ones is PerfView. PerfView provides facilities to capture traces as well as examine saved traces. It can be downloaded from Microsoft where it is shipped as a friendly standalone executable. Once extracted, launching it presents a help file and browser to find existing ETL log sessions.
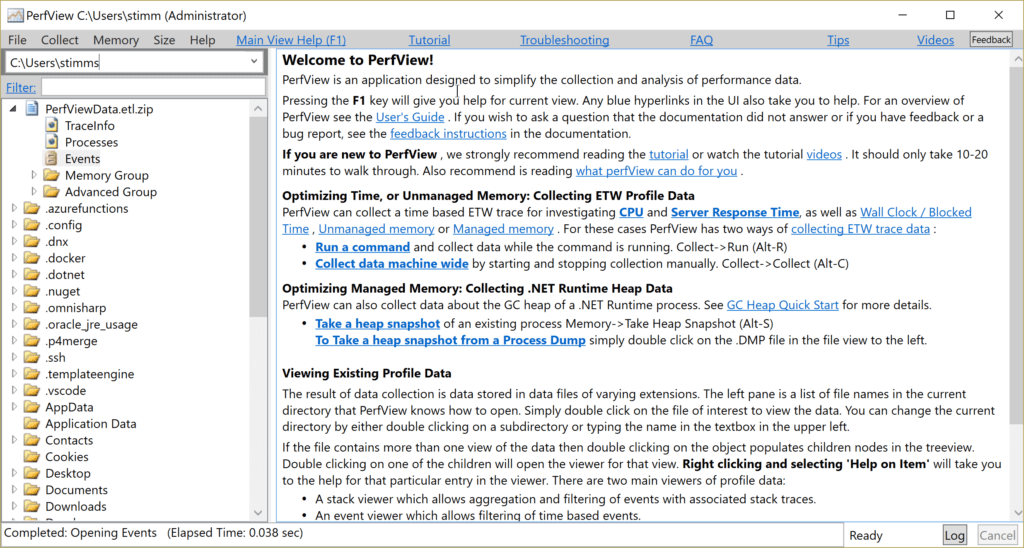
To start a new capture, select the Collect menu. This will present a screen that may have been designed by a programmer.
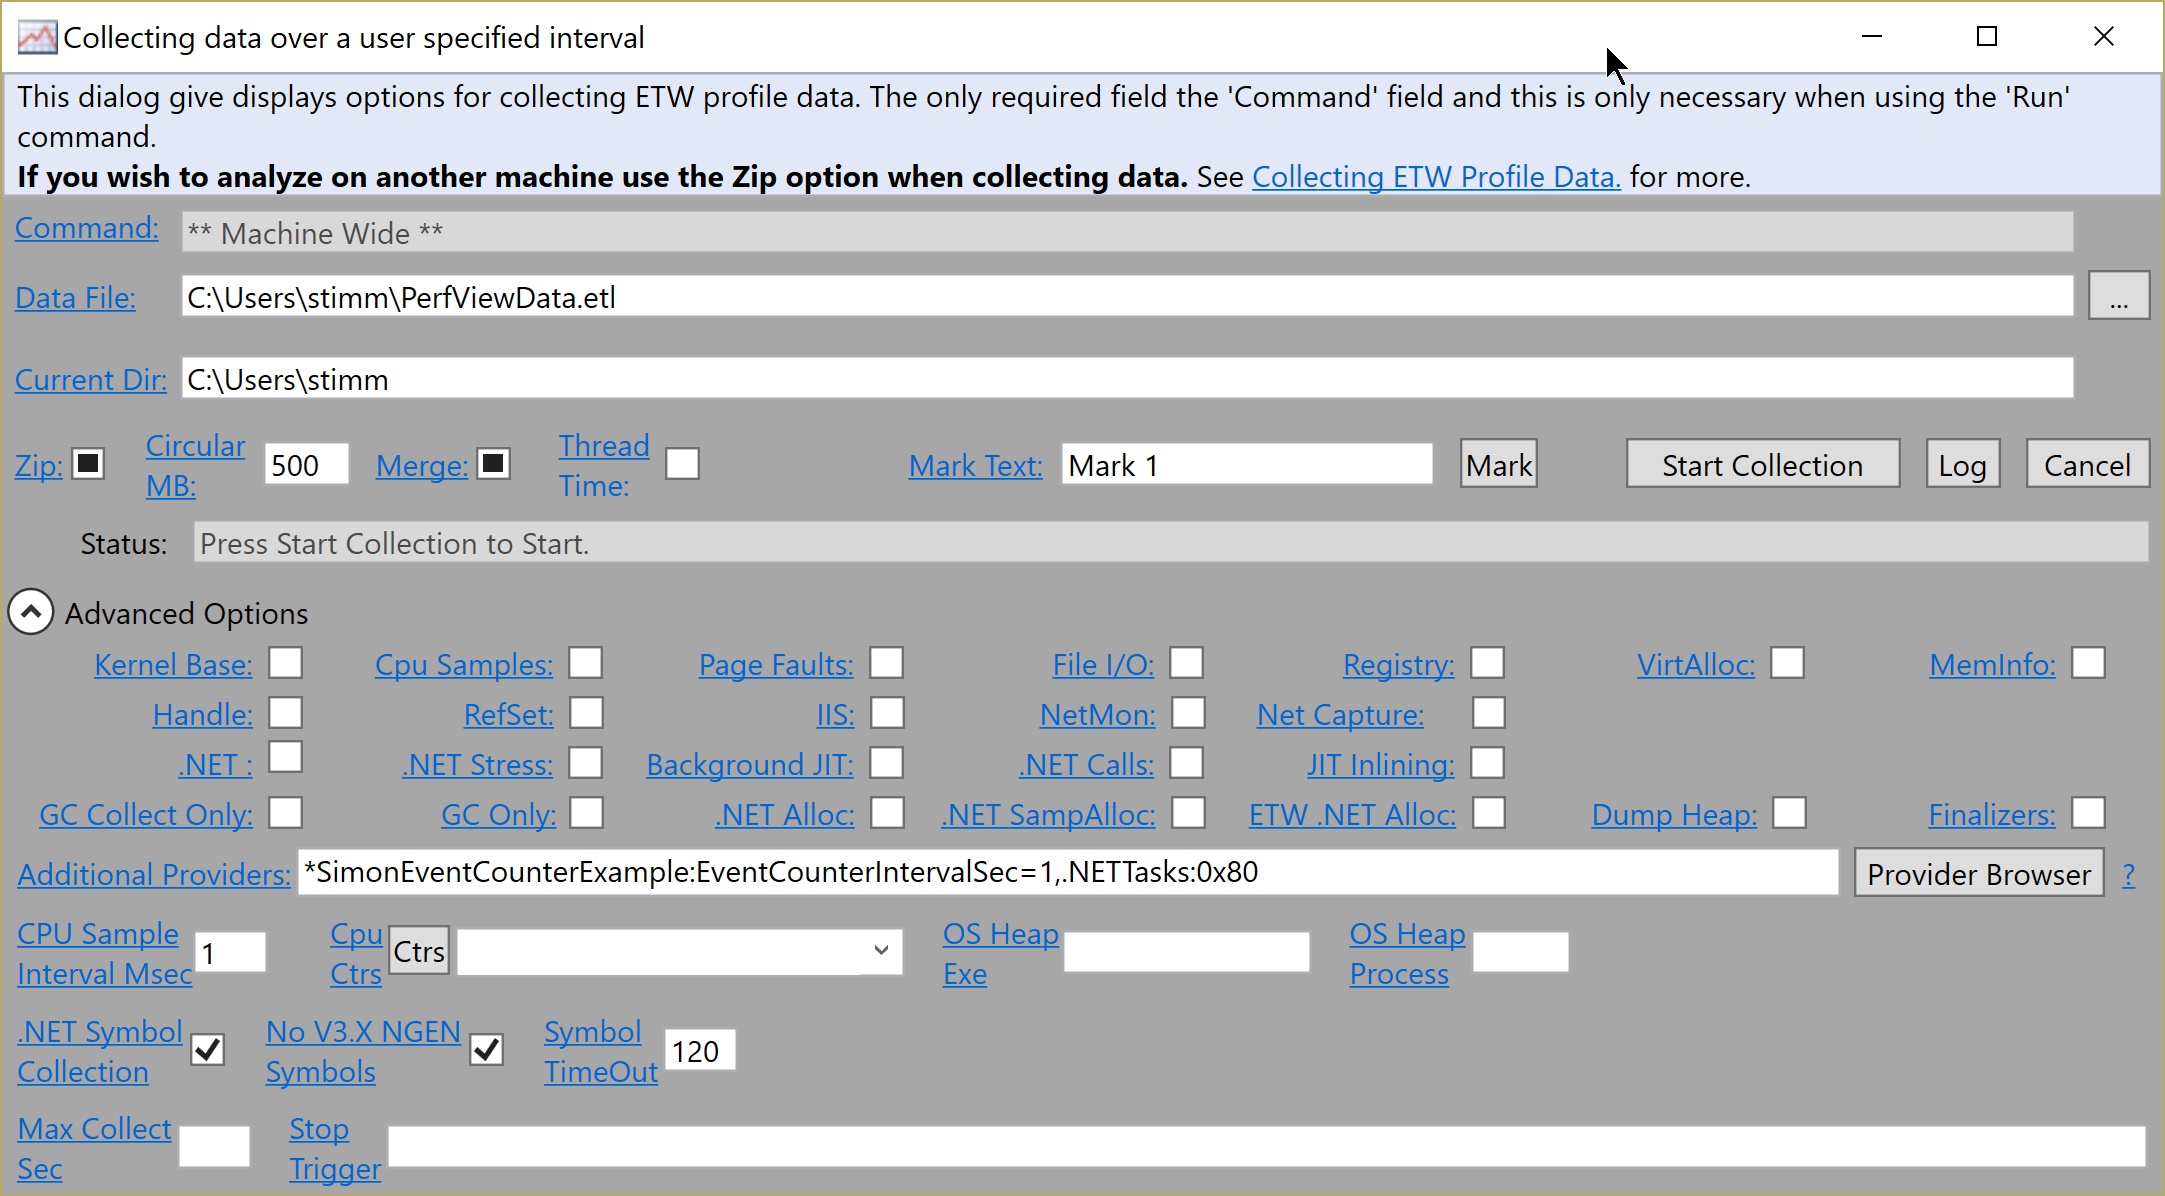
Clicking on “Start Collection” will kick off a new capture session. By default, the collection window will capture all events, so it is advisable to only capture data for a short period. The capture does use a circular buffer, so if you collect for too long a period the earlier events will be overwritten.
Capturing system events can be very useful. I was particularly struck by the usefulness of the TCP/IP captures since they showed information on every process that using the network, and on the inner workings of the .NET framework.
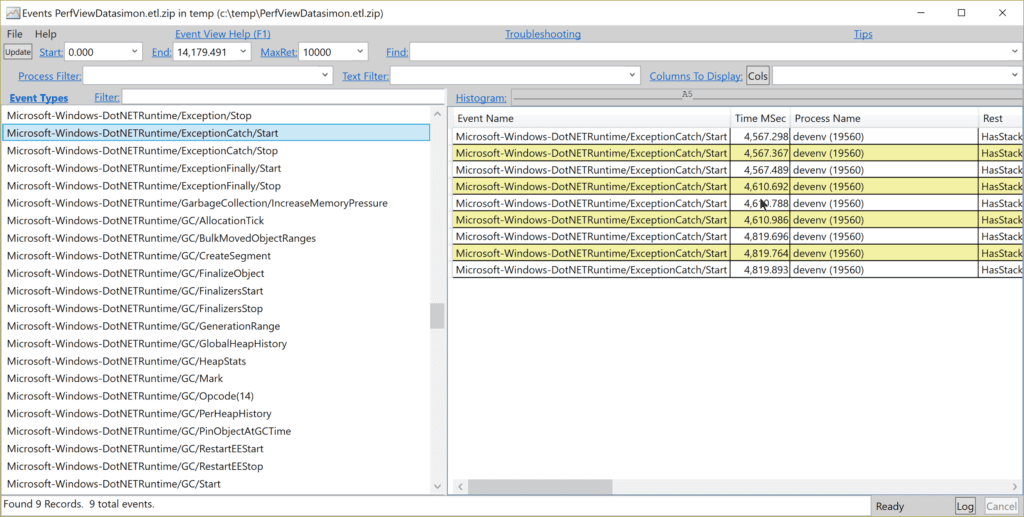
It’s interesting to see that in a period of 10 seconds, Visual Studio threw 9 exceptions that were handled. Of course, this only shows built-in events, and you’re encouraged to build your own events.
It has been possible to log to ETW from a .NET process for some time. More recently, writing event counters has been introduced. You may remember that event counters can be used when the details of log messages are not needed, and there is a great deal of throughput on a section of code. Event counters are not read continuously, but rather sampled, giving us a splash of values from which we can ascertain a trend.
The EventCounter class in System.Diagnostics.Tracing has had an interesting time. It was part of .NET Standard 1.5, but was not a part of full Framework 4.6.1, so there was a little gap. To use it against the full Framework, you’ll have to make use of .NET 4.7.1. Even then, you’ll need to include the System.Diagnostics.Tracing library (dll). As we move to fuller adoption of .NET Standard 2.0, it should be available in more places; however, it is unlikely to be implemented on Linux or macOS because it is unique to the Windows platform.
Following closely on the event counter tutorial in the corefx repository, let’s try building an event counter source example.
Create a new Visual Studio C# project and select .NET Framework 4.7.1. If this option doesn’t exist in your dropdown, you may need to download and manually install .NET Framework 4.7.1.
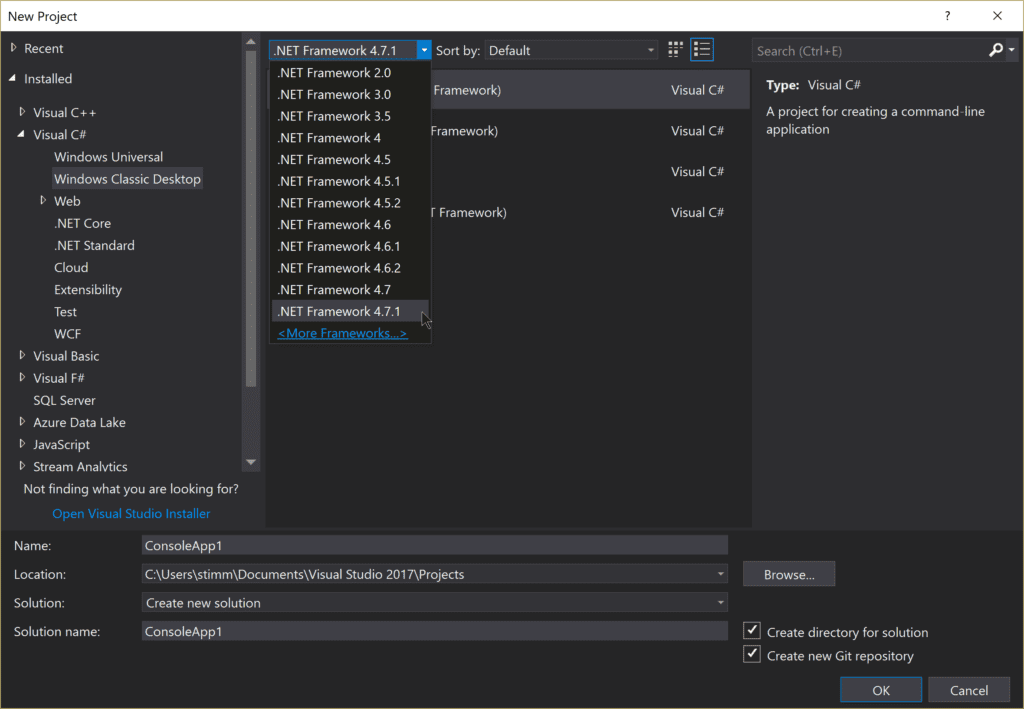
Our example will be responsible for counting chickens because that’s a thing that changes with great frequency. We’ll need a main method that generates a bunch of events.
static void Main(string[] args)
{
   var eventCounter = ETWLogger.Log;
   var random = new Random();

   Console.WriteLine("Starting application");

   for (int i = 0; i < 10_000; i++)
   {
      Thread.Sleep(random.Next(1, 500));
      eventCounter.CountChickens(random.Next(1, 5_000));
      Console.Write(".");
   }

   Console.WriteLine("Done.");
   Console.ReadLine();
}
Here we’re simply counting a random number of chickens at a random interval. The ETW logger looks like this:
[EventSource(Name = "ChickenEventCounterExample")]
public sealed class ETWLogger : EventSource
{
   public static ETWLogger Log = new ETWLogger();
   private EventCounter _counter;

   private ETWLogger()
   {
      this._counter = new EventCounter("chickens", this);
   }

   public void CountChickens(float numberOfChickens)
   {
      WriteEvent(1, "counting chickens before they've hatched", numberOfChickens);
      this._counter.WriteMetric(numberOfChickens);
   }
}
In this class, we inherit from EventSource and annotate our class with the name of the event source (“ChickenEventCounterExample”). In the constructor, we setup a new counter called chickens inside of event source. To view the results of this event counter, we can launch PerfView.
PerfView.exe /onlyproviders=*ChickenEventCounterExample:EventCounterIntervalSec=1 collect
The result of running it for 10 seconds is a collection of captures.
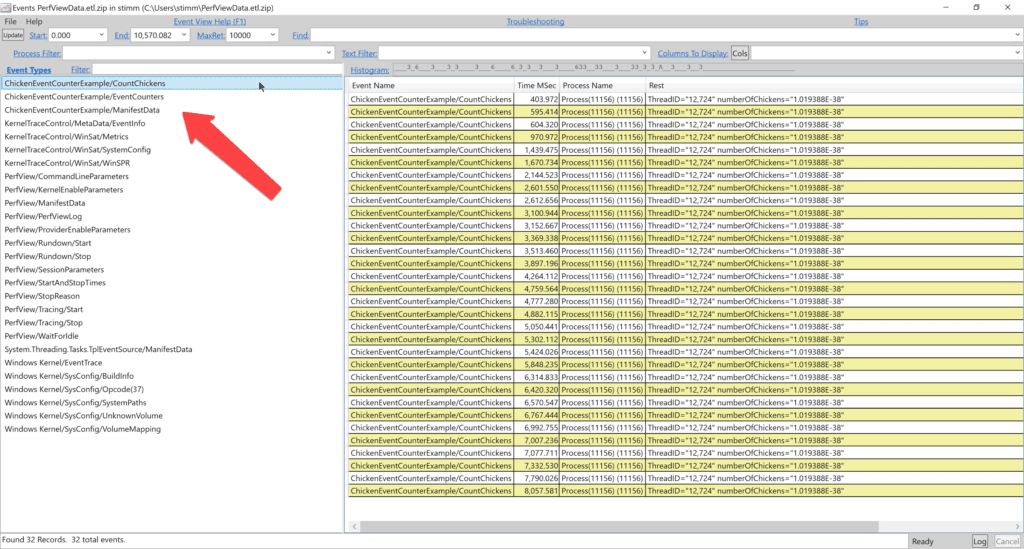
The first of the two new event sources here is the result of log events writing, and the second of the event counter itself. Digging into the event counter as seen below, we find that each entry contains a few statistics. The mean, standard deviation, count, and range of each polling is shown. Because we’re only polling at 1 second intervals, the counter has been called a number of times.

Counters provide a view into your application that might otherwise be difficult to get: gathering statistics on high-frequency events. While this sort of logging is not going to solve every problem, having access to it and being able to enable it for narrow periods adds yet another debugging tool to your toolbelt.
Stackify's APM tools are used by thousands of .NET, Java, PHP, Node.js, Python, & Ruby developers all over the world.
Explore Retrace's product features to learn more.
If you would like to be a guest contributor to the Stackify blog please reach out to stackify@stackify.com