By TechnologyAzure and AWS Monitoring
By IndustryIntegrates with your stack
By InitiativeEngineering & DevOps Teams
TechnicalIt’s easy to get the help you need

Every software development team is under a lot of pressure to ship product improvements as fast as possible. Most organizations now use agile methodologies and DevOps practices to ship software faster than ever. The reality is that software development is still a messy process.
A potential byproduct of every software deployment are new software defects that are found in production, either during regression / acceptance testing or (unfortunately) by your users or customers. It is inevitable that you will find new application errors, performance problems, quirky user experience problems, or some other issue. It is just the nature of the process. The goal is to find these defects and issues before they get to production.
One of the key metrics that your team should track is how many defects are found in pre-production testing versus in production. This ratio of where defects are found can help you create and track your defect escape rate.
How does your team quantify the quality of software releases that your team is shipping? Tracking how many defects make it to production is a great way to constantly gauge the overall quality of the software releases that your teams are doing.
Mark Zuckerberg is famous for saying “move fast and break things”. Obviously, we don’t want to break things in production environments. The balance of software development is figuring out how fast we can move, while taking an appropriate amount of risk.
Tracking your defect escape rate is a good way to know if you are moving too fast.
If you are finding too many issues in production, then you know that you’re not doing a good enough job of automated or manual testing, QA, etc. Use this key metric to know when you need to slow down or improve testing. Work on improving those practices, and then you can try moving faster again. Your defect escape rate is a great constant feedback loop to how your team is doing.
The key to tracking your defect escape rate is tracking all defects that are found in your software. This includes issues found during QA and especially in production. You should create new work items for every defect in your application lifecycle management (ALM) tool. These are tools like Axosoft OnTime, Rally, VersionOne, Atlassian’s Jira, Microsoft Team Services, etc that virtually every development team uses.
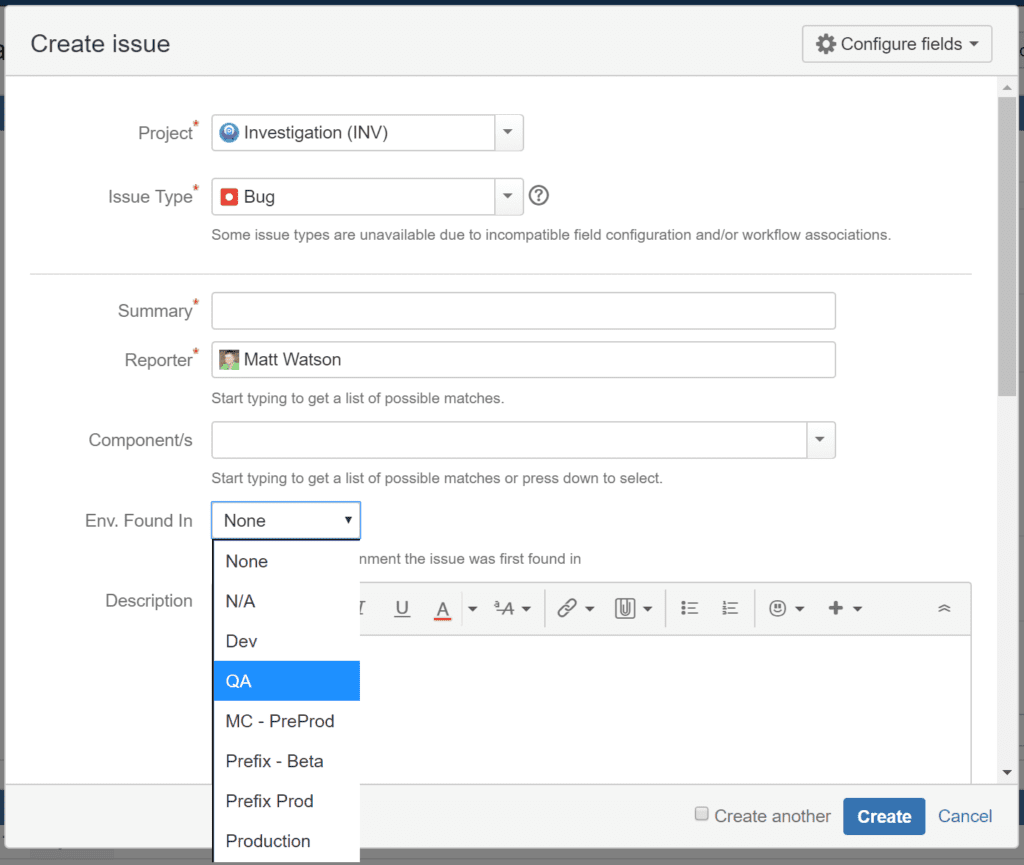
The best way to track your defect escape rate is to tag each defect when you create the work item to know where the defect was found. Track if it was found in QA, staging, production, etc. By tracking where it was found, you can then create the reporting that you need to track your defect escape rate.
At Stackify, we use Jira for tracking our work items. We are able to track where we find defects by customizing Jira to add a custom field to our work items.

As part of Stackify weekly executive meetings, our defect escape rate is a key metric that the executive team looks at. It gives us a good idea of the job our development team is doing with overall software testing and quality.
Your defect escape rate is expressed as a percentage based on how many defects you find before they get to production or how many make it to production, however you prefer. Every software project and team will be different, but we suggest striving to find 90% of all defects before they get to production. By constantly focusing on this metric, it will help drive software quality into your entire development team effort.
If defect escape rate is a new concept for you, I hope you can now see the value in tracking it and how to track it. Ultimately, your next goal will be focusing on how to improve it. Your defect escape rate helps you understand how good of a job your team is doing as a whole.
To improve your defect escape rate, you will have to constantly review what type of defects are slipping through the cracks and making it to production. Based on the type of defects that are making it to production, there are a few different best practices I would consider.
The best time to find bugs is when they are being created!
Developers have access to a lot of tools that can help them find bugs while they are writing and testing their own code. It is hard to imagine the days when developers fed a stack of punch cards into a mainframe and waited to figure out if it worked or not.
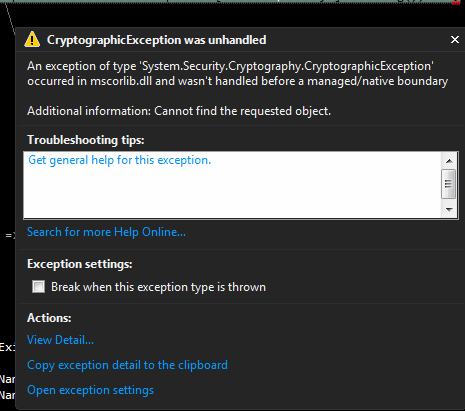
We are definitely spoiled these days by interactive debuggers, code profilers, and other awesome IDE and developer tools. One of my favorite features of Visual Studio is its ability to automatically break on exceptions. This sure makes it a lot easier to find exceptions!

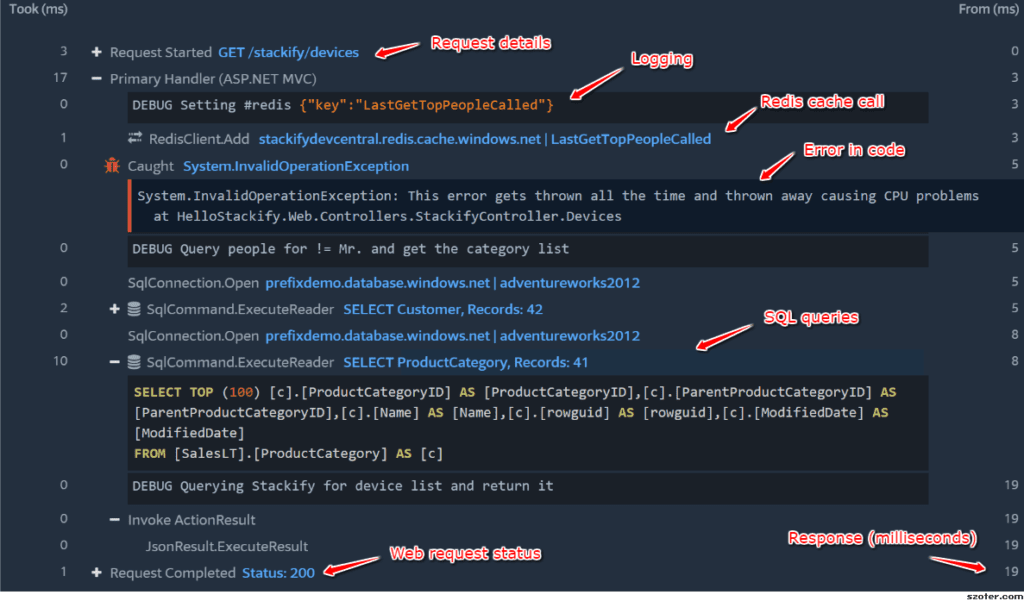
Stackify provides pretty an awesome tool called Prefix that your development team should definitely be using. It collects every web request or transaction that is happening within your application and provides an instant view of what that web request just did.
This enables developers to see how long SQL queries take, how many SQL queries are called, hidden exceptions in their code, and many other details that they otherwise wouldn’t have known.
Prefix is free, so be sure to check it out!

For every work item that your development team is working on, they should include notes about what types of automated testing currently exist related to the work item and what type of manual testing may need to be done. By forcing your team to think about the test strategy for every work item, it ensures that they are always thinking about producing high quality code and how to test it.
I worked on a work item this week to improve how our app did some data processing. This app has a pretty large and thorough set of unit tests in place that provide us a high level of confidence.
For this type of work item, your team should note in the work item that unit tests exist, perhaps new ones were made, and that all the unit tests pass. You may also want to include any other notes about additional manual things to potentially test outside of the scope of the automated tests.
This week I was also working on a bug in one of our applications that was causing high memory and CPU usage. Unfortunately, that isn’t something that unit testing or automated testing can easily validate.
For this type of work item, it would be important to give the QA team detailed notes that they specifically need to review CPU and memory usage in regards to this release.
Software testing is a hard and complicated problem. There are several different types of automated and manual testing strategies. Depending on your type of application, they can all be very helpful. One of the problems is figuring out the level of testing that you need to perform.
Unit testing every line of code is definitely very extreme and not needed. The key is testing business logic and conditional aspects of your code. For example, at Stackify we profile application code at runtime to monitor the performance of web applications. Part of this includes parsing SQL statements executed by applications that our platform instruments.
As you can imagine, something like parsing SQL statements is a perfect example of a scenario to use unit testing. There is a vast array of scenarios and we need to know they all work. If we make any changes in the parsing logic, we need to be confident that we haven’t broken anything. Doing this type of testing is the perfect example of a unit test: it requires little setup or configuration. A sample set of data can easily be asserted for correctness in how it is parsed, with known and expected outcomes.
Well designed code patterns (inversion of control, etc) lend themselves well to unit testing. If testing something basic requires too much setup or hard dependencies, you are introducing fragility and bad patterns to your code base.
There are several other types of testing outside of just unit testing. One of the other really important ones is automated synthetic or functional tests. These are the types of tests that you can record with something like Selenium to automatically test your web application in a web browser.
You should definitely use these types of tests to cover the most important parts of your software. Things like logging in and validating that you can navigate to key parts of your user interface.
If you want to ship code fast and at a high quality, automated testing is critical. If you are serious about software quality, you also need to get serious about using continuous integration tools. Continuous integration tools can run all of your automated testing for you and give you immediate feedback if any recent code commits have broken anything. By combining continuous deployment with continuous integration, you can continually deploy new builds and testing them. This create a fast feedback loop.
To learn more about software testing, be sure to check out our guide: Software Testing Tips: 101 Expert Tips, Tricks and Strategies for Better, Faster Testing and Leveraging Results for Success
Tracking your defect escape rate is all about finding problems before they get to production. The best place to find them is in QA. But how do you find them in QA?
You deployed to QA and all of your automated tests passed. Everything is good right? No. No matter what, you will always need to do a fair amount of manual testing. Your application is also always going to behave differently in different environments due to the differences in data.
The best development teams track every time they do a deployment to QA. After they do the deployment and complete all of the testing, they leverage application monitoring tools like Retrace to find potential exceptions and performance problems.
Retrace runs on your server and collects data about what your code is doing and how it performs. It can collect data while you are doing automated functional tests with something like Selenium, load testing, and of course manual testing.
The goal is to not find defects in production … so having a goal of finding them sounds counterintuitive. However, you want to find the defects before your customers do or before they cost you business because your customers are all mad and just run away.
Also, if you want to be honest with yourself about your defect escape rate, you need to find defects in production and not forget to log all of them in Jira, or whatever tool you are using.
Finding defects in production is a lot like finding them in QA. After every release you should run your automated functional tests and do some manual testing. On top of that you can monitor the performance of your applications from all of your users.
During a deployment you should keep an eye on your application monitoring tools. Here are some things to look for during a deployment:
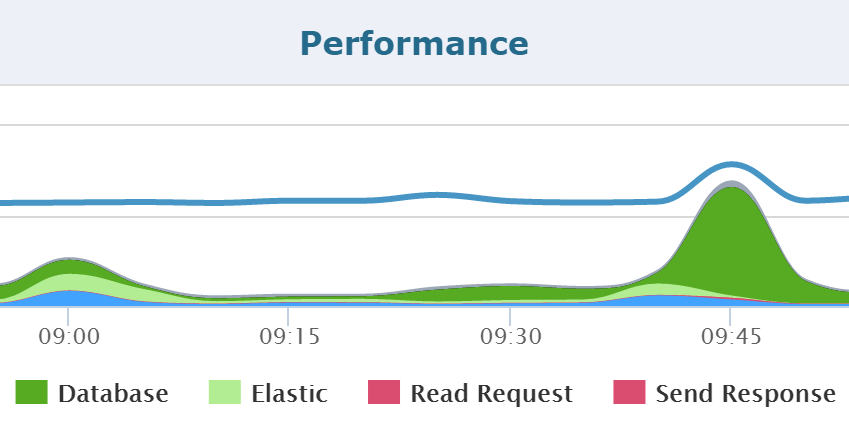
After a deployment, you want to look for spikes like this shown below via Retrace. If all of a sudden, you are having database performance issues, perhaps something in your deployment is causing performance issues that you were not seeing before.

After a deployment you should also wait a few hours and look for all of these things again.
Actually, these are all things that you should monitor on an ongoing basis. Application performance management tools like Retrace can help your team continuously monitor and improve the performance of your applications.
[adinserter block=”33″]
If your goal is to ship software as fast as possible, you need some key metrics to help guide if your team is doing a good job or not.
Defect escape rate is one good metric to track. At a high level, it can tell you if your team is shipping code that is causing a lot of defects that make it to production or not.
At the end of the day, we need to know if we are doing a good bad job so that we know if we need to improve. The defect escape rate is a great metric that can help grade how your team is doing.
Stackify's APM tools are used by thousands of .NET, Java, PHP, Node.js, Python, & Ruby developers all over the world.
Explore Retrace's product features to learn more.
If you would like to be a guest contributor to the Stackify blog please reach out to stackify@stackify.com