By TechnologyAzure and AWS Monitoring
By IndustryIntegrates with your stack
By InitiativeEngineering & DevOps Teams
TechnicalIt’s easy to get the help you need

Serious software development calls for performance optimization. When you start optimizing application performance, you can’t escape looking at profilers. Whether monitoring production servers or tracking frequency and duration of method calls, profilers run the gamut. In this article, I’ll cover the basics of using a Python profiler, breaking down the key concepts, and introducing the various libraries and tools for each key concept in Python profiling.
First, I’ll list each key concept in Python profiling. Then I’ll break each key concept into three key parts:
APM tools are ideal for profiling the entire life cycle of transactions for web applications. Most of the APM tools probably aren’t written in Python, but they work well regardless of the language your web app is written in.
Before we begin, note that I’ll focus only on Python 3 examples because 2.7 is scheduled to be retired on January 1, 2020. Therefore, the code examples in this post will use python3 as the Python 3 executable. With that structure in mind, let’s begin!
Formally, tracing is a special use case of logging in order to record information about a program’s execution. Because this use case is so similar to event logging, the differences between event logging and tracing aren’t clear-cut. Event logging tends to be ideal for systems administrators, whereas software developers are more concerned with tracing to debug software programs. Here’s a one-liner for thinking about tracing—it’s when software developers use logging to record information about a software execution. In the open source Python Standard Library, the trace and faulthandler modules cover basic tracing.
The Python docs for the trace module don’t say much, but the Python Module of the Week (PyMOTW) has a succinct description that I like. It says that trace will “follow Python statements as they are executed.” The purpose of trace module is to “monitor which statements and functions are executed as a program runs to produce coverage and call-graph information.” I don’t want to get into too many details with trace, so I’ll use some of the excellent examples in PyMOTW and leave you to dive deeper if you want.
Using the same sample code in PyMOTW:
from recurse import recurse

def main():
    print 'This is the main program.'
    recurse(2)
    return

print 'recurse(%s)' % level

if level:
    recurse(level-1)
    return

def not_called():
    print 'This function is never called.'

if __name__ == '__main__':
    main()

def recurse(level):
You can do several things with trace:
You can dig into more of the details at the Python Module of the Week documentation.
By contrast, faulthandler has slightly better Python documentation. It states that its purpose is to dump Python tracebacks explicitly on a fault, after a timeout, or on a user signal. It also works well with other system fault handlers like Apport or the Windows fault handler. Both the faulthandler and trace modules provide more tracing abilities and can help you debug your Python code. For more profiling statistics, see the next section.
If you’re a beginner to tracing, I recommend you start simple with trace.
For APM options, there are tools like Jaeger and Zipkin. Although they’re not written in Python, they work well for web and distributed applications. Jaeger officially supports Python, is part of the Cloud Native Computing Foundation, and has a more extensive deployment documentation. For these reasons, I recommend starting with Jaeger if you want tracing requests in a distributed web architecture. If it doesn’t suit your tracing needs in a distributed system, then you can look at Zipkin.
Now let’s delve into profiling specifics. The term “profiling” is mainly used for performance testing, and the purpose of performance testing is to find bottlenecks by doing deep analysis. So you can use tracing tools to help you with profiling. Recall that tracing is when software developers log information about a software execution. Therefore, logging performance metrics is also a way to perform profiling analysis.
But we’re not restricted to tracing. As profiling gains mindshare in the mainstream, we now have tools that perform profiling directly. Now the question is, what parts of the software do we profile (measure its performance metrics)?
Typically, we profile:
Before I go into each of these and provide the generic Python and APM options, let’s explore what metrics to use for profiling and the profiling techniques themselves.
Typically, one thing we want to measure when profiling is how much time is spent executing each method. When we use a method profiling tool like cProfile (which is available in the Python language), the timing metrics for methods can show you statistics, such as the number of calls (shown as ncalls), total time spent in the function (tottime), time per call (tottime/ncalls and shown as percall), cumulative time spent in a function (cumtime), and cumulative time per call (quotient of cumtime over the number of primitive calls and shown as percall after cumtime). The specific timing metrics may vary from tool to tool, but generally, you can expect something similar to cProfile’s choice of timing metrics in similar tools.

Another metric to consider when profiling is the number of calls made on the method. If a method has an acceptable speed but is so frequently called that it becomes a huge time sink, you would want to know this from your profiler. For example, cProfile highlights the number of function calls and how many of those are native calls.
Most profiling tutorials will tell you how to track a method’s timing metrics. That’s also what I recommend you start with, especially if you’re a beginner to profiling.
Line profiling, as the name suggests, means to profile your Python code line by line. The most common metrics used for line profiling are timing metrics. Think of it as similar to method profiling, but more granular. If you’re a beginner, start with profiling methods first. When you’re comfortable with profiling methods, and you need to profile lines, then feel free to proceed as such.
Both cProfile and profile are modules available in the Python 3 language. The numbers produced by these modules can be formatted into reports via the pstats module.
Here’s an example of cProfile showing the numbers for a script:
import cProfile
import re

cProfile.run('re.compile("foo|bar")')

197 function calls (192 primitive calls) in 0.002 seconds
Ordered by: standard name
ncalls tottime percall cumtime percall filename:lineno(function)
1 0.000 0.000 0.001 0.001 :1()
1 0.000 0.000 0.001 0.001 re.py:212(compile)
1 0.000 0.000 0.001 0.001 re.py:268(_compile)
1 0.000 0.000 0.000 0.000 sre_compile.py:172(_compile_charset)
1 0.000 0.000 0.000 0.000 sre_compile.py:201(_optimize_charset)
4 0.000 0.000 0.000 0.000 sre_compile.py:25(_identityfunction)
3/1 0.000 0.000 0.000 0.000 sre_compile.py:33(_compile)
As you can see, the various time metrics covered under Profile by Speed (Time) (such as ncalls and tottime) are in this example of cProfile as well. The profile module gives similar results with similar commands. Typically, you switch to profile if cProfile isn’t available.
Most APM tools are pretty fully-fledged monitoring tools. They’ll typically provide line and method profiling. Timing metrics are first-class citizens in these tools. I won’t list out the tools here because almost all will have these features.

Another common component to profile is the memory usage. The purpose is to find memory leaks and optimize the memory usage in your Python programs. In terms of generic Python options, the most recommended tools for memory profiling for Python 3 are the pympler and the objgraph libraries.
Pympler’s documentation offers more details. You can use pympler to:
The documentation will give you explicit examples. Here, I want to highlight an example I find most useful—tracking the lifetime of objects for classes:
>>> from pympler import classtracker
>>> tr = classtracker.ClassTracker()
>>> tr.track_class(Document)
>>> tr.create_snapshot()
>>> create_documents()
>>> tr.create_snapshot()
>>> tr.stats.print_summary()
active 1.42 MB average pct
Document 1000 195.38 KB 200 B 13%
This example shows that the total measured memory footprint is 1.42 MB, with 1,000 active nodes averaging 200B in size. There are many tutorials in the pympler documentation, including one to track memory usage in Django with the Django Debug toolbar.
According to its creator, objgraph’s purpose was to help find memory leaks. As Marius Gedminas said, “The idea was to pick an object in memory that shouldn’t be there and then see what references are keeping it alive.”
I’d say that Marius emphasized making the visualization better in objgraph than in other memory profiling tools. And that’s its strength. Marius once demonstrated how objgraph helps find memory leaks, but I won’t reproduce it here due to space constraints.
There’s no APM tool that specializes in memory profiling.
When we do profiling, it means we need to monitor the execution. That in itself may affect the underlying software being monitored. Either we monitor all the function calls and exception events, or we use random sampling and deduce the numbers. The former is known as deterministic profiling, and the latter is statistical profiling. Of course, each method has its pros and cons. Deterministic profiling can be highly precise, but its extra overhead may affect its accuracy. Statistical profiling has less overhead in comparison, with the drawback being lower precision.
cProfile, which I covered earlier, uses deterministic profiling. Let’s look at another open source Python profiler that uses statistical profiling: pyinstrument.
Pyinstrument differentiates itself from other typical profilers in two ways. First, it emphasizes that it uses statistical profiling instead of deterministic profiling. It argues that while deterministic profiling can give you more precision than statistical profiling, the extra precision requires more overhead. The extra overhead may affect the accuracy and lead to optimizing the wrong part of the program. Specifically, it states that using deterministic profiling means that “code that makes a lot of Python function calls invokes the profiler a lot, making it slower.” This is how results get distorted and the wrong part of the program gets optimized.
Second, pyinstrument differentiates itself by being a “full-stack recording.” Let’s compare it with cProfile. cProfile typically measures a list of functions and then orders them by the time spent in each function. By contrast, Pyinstrument is designed such that it will track, for example, the reason every single function gets called during a web request—hence, the full-stack recording feature. This makes pyinstrument ideal for popular Python web frameworks like Flask and Django. And full-stack recording is exactly the last concept I’m going to cover.
Arguably, all the various APM tools out in the market can be said to have the feature of full-stack recording. The idea behind full-stack recording is that, as a request progresses through each layer in the stack, we want to see in which layer of the stack the bottleneck in the performance occurs. Of course, sometimes the slowness can occur outside your Python script.
Earlier, I covered an open source Python profiler option: pyinstrument. Here, I’ll cover other well-known APM options.
You can divide the APM options into two types:
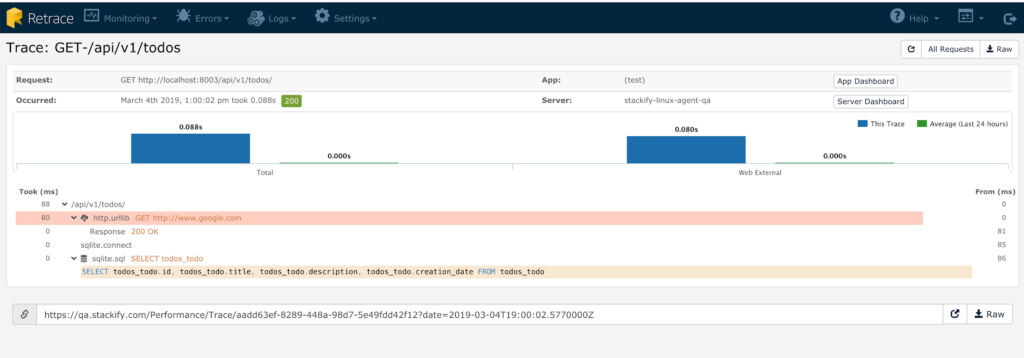
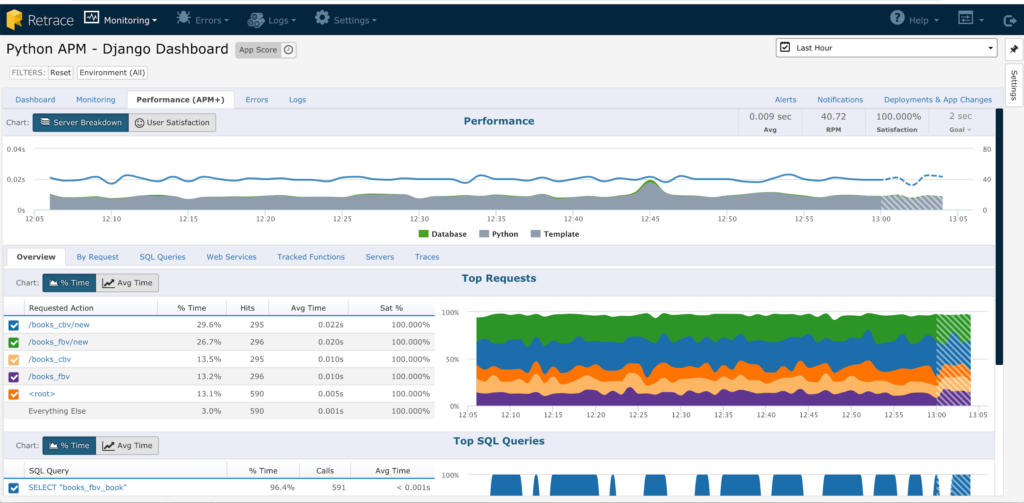
For a Python-specific open source APM, you can check out Elastic APM. Python-specific hosted APM options include New Relic, AppDynamics, and Scout. The hosted APM options are similar to Stackify’s own Retrace. Retrace, however, is a one-stop shop, replacing several other tools and only charges by usage. On top of profiling your application code, these tools also trace your web request. You can see how your web request consumes wall-clock time through the technology stack, including database queries and web server requests. This makes these options great as profiling tools, if you have a web or distributed application.

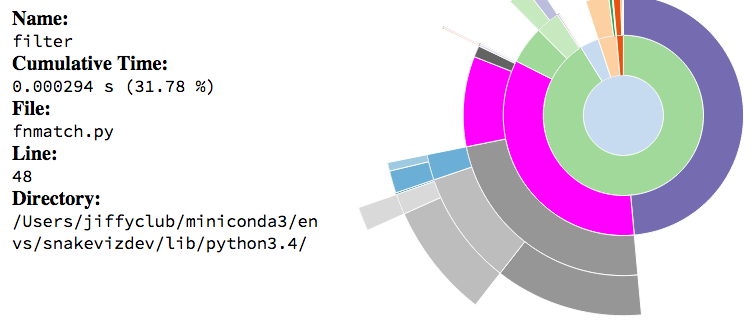
Strictly speaking, profile viewers aren’t profilers, but they can help turn your profiling statistics into a more visually pleasing display. One example is SnakeViz, which is a browser-based graphical viewer for the output of Python’s cProfile module. One thing I like about SnakeViz is that it provides a sunburst diagram, as seen below:

Another option to better display statistics from your cProfile statistics is tuna. Tuna handles runtime and import profiles, and it uses D3 and Bootstrap as the underlying technologies for display.
I’ve covered all the major concepts, running from tracing to profile viewers, in the area of Python profiling. So, use this post to pick the level and area of profiling you want to do. I recommend starting small and easy, if you’ve never done profiling before. Once you get the hang of it, you can experiment with more complex tooling. Good luck optimizing!
Stackify's APM tools are used by thousands of .NET, Java, PHP, Node.js, Python, & Ruby developers all over the world.
Explore Retrace's product features to learn more.
If you would like to be a guest contributor to the Stackify blog please reach out to stackify@stackify.com