By TechnologyAzure and AWS Monitoring
By IndustryIntegrates with your stack
By InitiativeEngineering & DevOps Teams
TechnicalIt’s easy to get the help you need

Need help on how to monitor IIS? This guide covers the basics, including HTTP ping checks, IIS Application Pools, and important Windows Performance Counters.
In addition, we’ll take a look at how to use an application performance management system to simplify monitoring IIS and get more advanced IIS performance monitoring for ASP.NET applications.
Without monitoring IIS performance, you could end up leaving your site (and your users) hanging which, at best, will leave a bad taste in your user’s mouths and at worst, they’ll stop using your services.
So, let’s get into this guide, where we’ll start with the basics and then move into more advanced ways to monitor IIS performance.

The first thing you want to do is set up monitoring to ensure that your application is running.
One of the best and easiest things you can do is set up a simple HTTP check that runs every minute, which will give you a baseline to know if your site is up or down. In addition, it can also help you track how long it takes to respond.
For instance, you could monitor for a 200 OK status or similarly, the request may return specific text that you know should be included in the response.
As a side note, be careful not to rely on cached responses in your check since a 200 status response is cacheable.
Additionally, monitoring IIS via a simple HTTP check is a good way to establish a basic SLA monitor, which you can use no matter how many servers you have, to know if your web application was online and available.
For example, one of the HTTP checks we use against Elasticsearch to help with monitoring it. We do this via Retrace.
In this example, we receive alerts if the number_of_nodes is not what we are expecting or if it doesn’t find an HTTP status of 200 OK.

If you’ve been using IIS for a while, you’ve probably witnessed times when your application mysteriously stops working.
After some troubleshooting, you may find that your IIS Application Pool is stopped for some reason, which causes your site to go offline and your savvy users to check Downdetector to see if it’s you or them.
Sometimes an IIS Application Pool will crash and stop for any of several reasons.
For example, fatal application errors can kill the Application Pool. Other causes can be the user the app pool is running under, bad configurations, or other random problems. The Application Pool can get into a state where it won’t start at all.
Above all, it’s important to always monitor that your IIS Application Pool is started. It runs as w3wp.exe.
Most monitoring tools have a way to monitor IIS Application Pools. For example, Retrace monitors them by default.
As a side note, app pools can be set to “Started” but may not actually be running as w3wp.exe if there is no traffic to your application.

In these scenarios, w3wp.exe may not be running, but there’s no actual problem, which is why you need to monitor it via IIS’s status and not just look for w3wp.exe to be running on your server.
One of the advantages of using IIS as a web server is all of the metrics available via Windows Performance Counters. There’s a wide array of them available between IIS, ASP.NET and .NET.
For this guide on IIS performance monitoring, I’m going to review some of the top Performance Counters to monitor.
To simplify things a bit, I’m going to split the Performance Counters up between IIS and ASP.NET particular Performance Counters. All of these are monitored by default as part of Retrace’s application metrics monitoring.
MORE: MSDN on ASP.NET Performance Counters
You should be able to monitor these Windows Performance Counters with most server monitoring solutions.
Additionally, some Windows Performance Counters are difficult to monitor because of the process name or ID changes constantly, which makes it hard to monitor them in some server monitoring solutions due to this.
If you are looking for a simple to use ASP.NET performance monitoring solution, that is easy to use, be sure to check out our product, Retrace.
Some application monitoring tools, like Retrace, are designed to provide holistic monitoring for your ASP.NET applications.
To get started, all that you have to do is install them, and they can auto-detect all of your ASP.NET applications. From there, it will automatically start monitoring all the basics.

Retrace will monitor IIS key Performance Counters and the state of your IIS Site and Application Pool.
Besides the basic checks, Retrace also does lightweight profiling of your ASP.NET cod, giving you code-level visibility to understand how your application is performing and how to improve it.

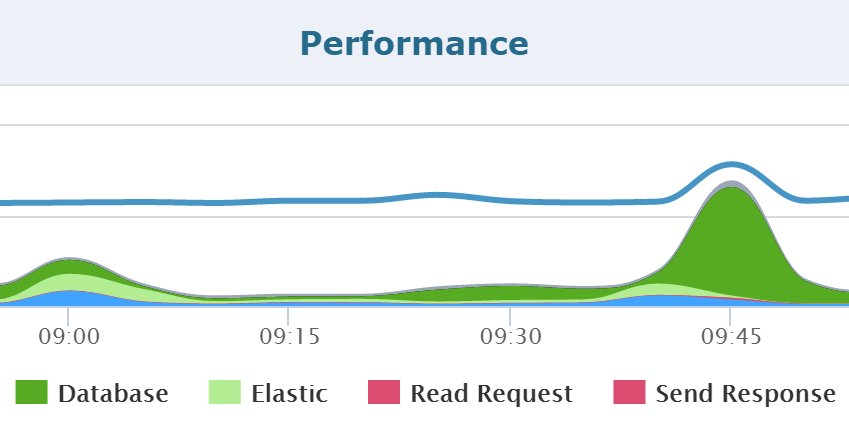
Track performance of every ASP.NET web request in your application:
How you monitor IIS can be as simple or robust as you would like.
While, a basic HTTP test is the simplest way to keep tabs on whether or not your site is up and running and gives you checks on IIS itself or monitor IIS using performance counters, it is not enough.
To really understand the performance of your application, you should check out an application performance management system like Retrace, which does so much more!
More: How to Troubleshoot IIS Worker Process (w3wp) High CPU Usage
Stackify's APM tools are used by thousands of .NET, Java, PHP, Node.js, Python, & Ruby developers all over the world.
Explore Retrace's product features to learn more.
If you would like to be a guest contributor to the Stackify blog please reach out to stackify@stackify.com