By TechnologyAzure and AWS Monitoring
By IndustryIntegrates with your stack
By InitiativeEngineering & DevOps Teams
TechnicalIt’s easy to get the help you need

How many combined log statements do your applications and infrastructure produce in a day? 50,000? Over a million? Here at Stackify, our applications generate around 100 million log entries every day. Even after feeding them into Stackify’s powerful log management and filtering tools, it can be difficult to distill things down into meaningful, actionable diagnostics with an incredibly high volume of logs constantly arriving.

Figure 1: 3.75 million log statements… per hour.
By simply including hashtag-style keywords in your plain text log messages, you can vastly improve your ability to search, monitor, categorize, and understand events in your production software. When a log message arrives at Stackify, tags are automatically inferred from any word prepended with “#.” There is no limit to the number of tags that can be included in a log statement.
//Adding tags is as easy as adding a #

            log.Debug("Write to #queue complete");
Once tagged log statements have been indexed, you can quickly and easily filter by the contained tags by searching for them or clicking anywhere that you see them highlighted in the output.

Figure 2: Using our tag, we immediately filtered down to about 60 log statements per hour … much better!
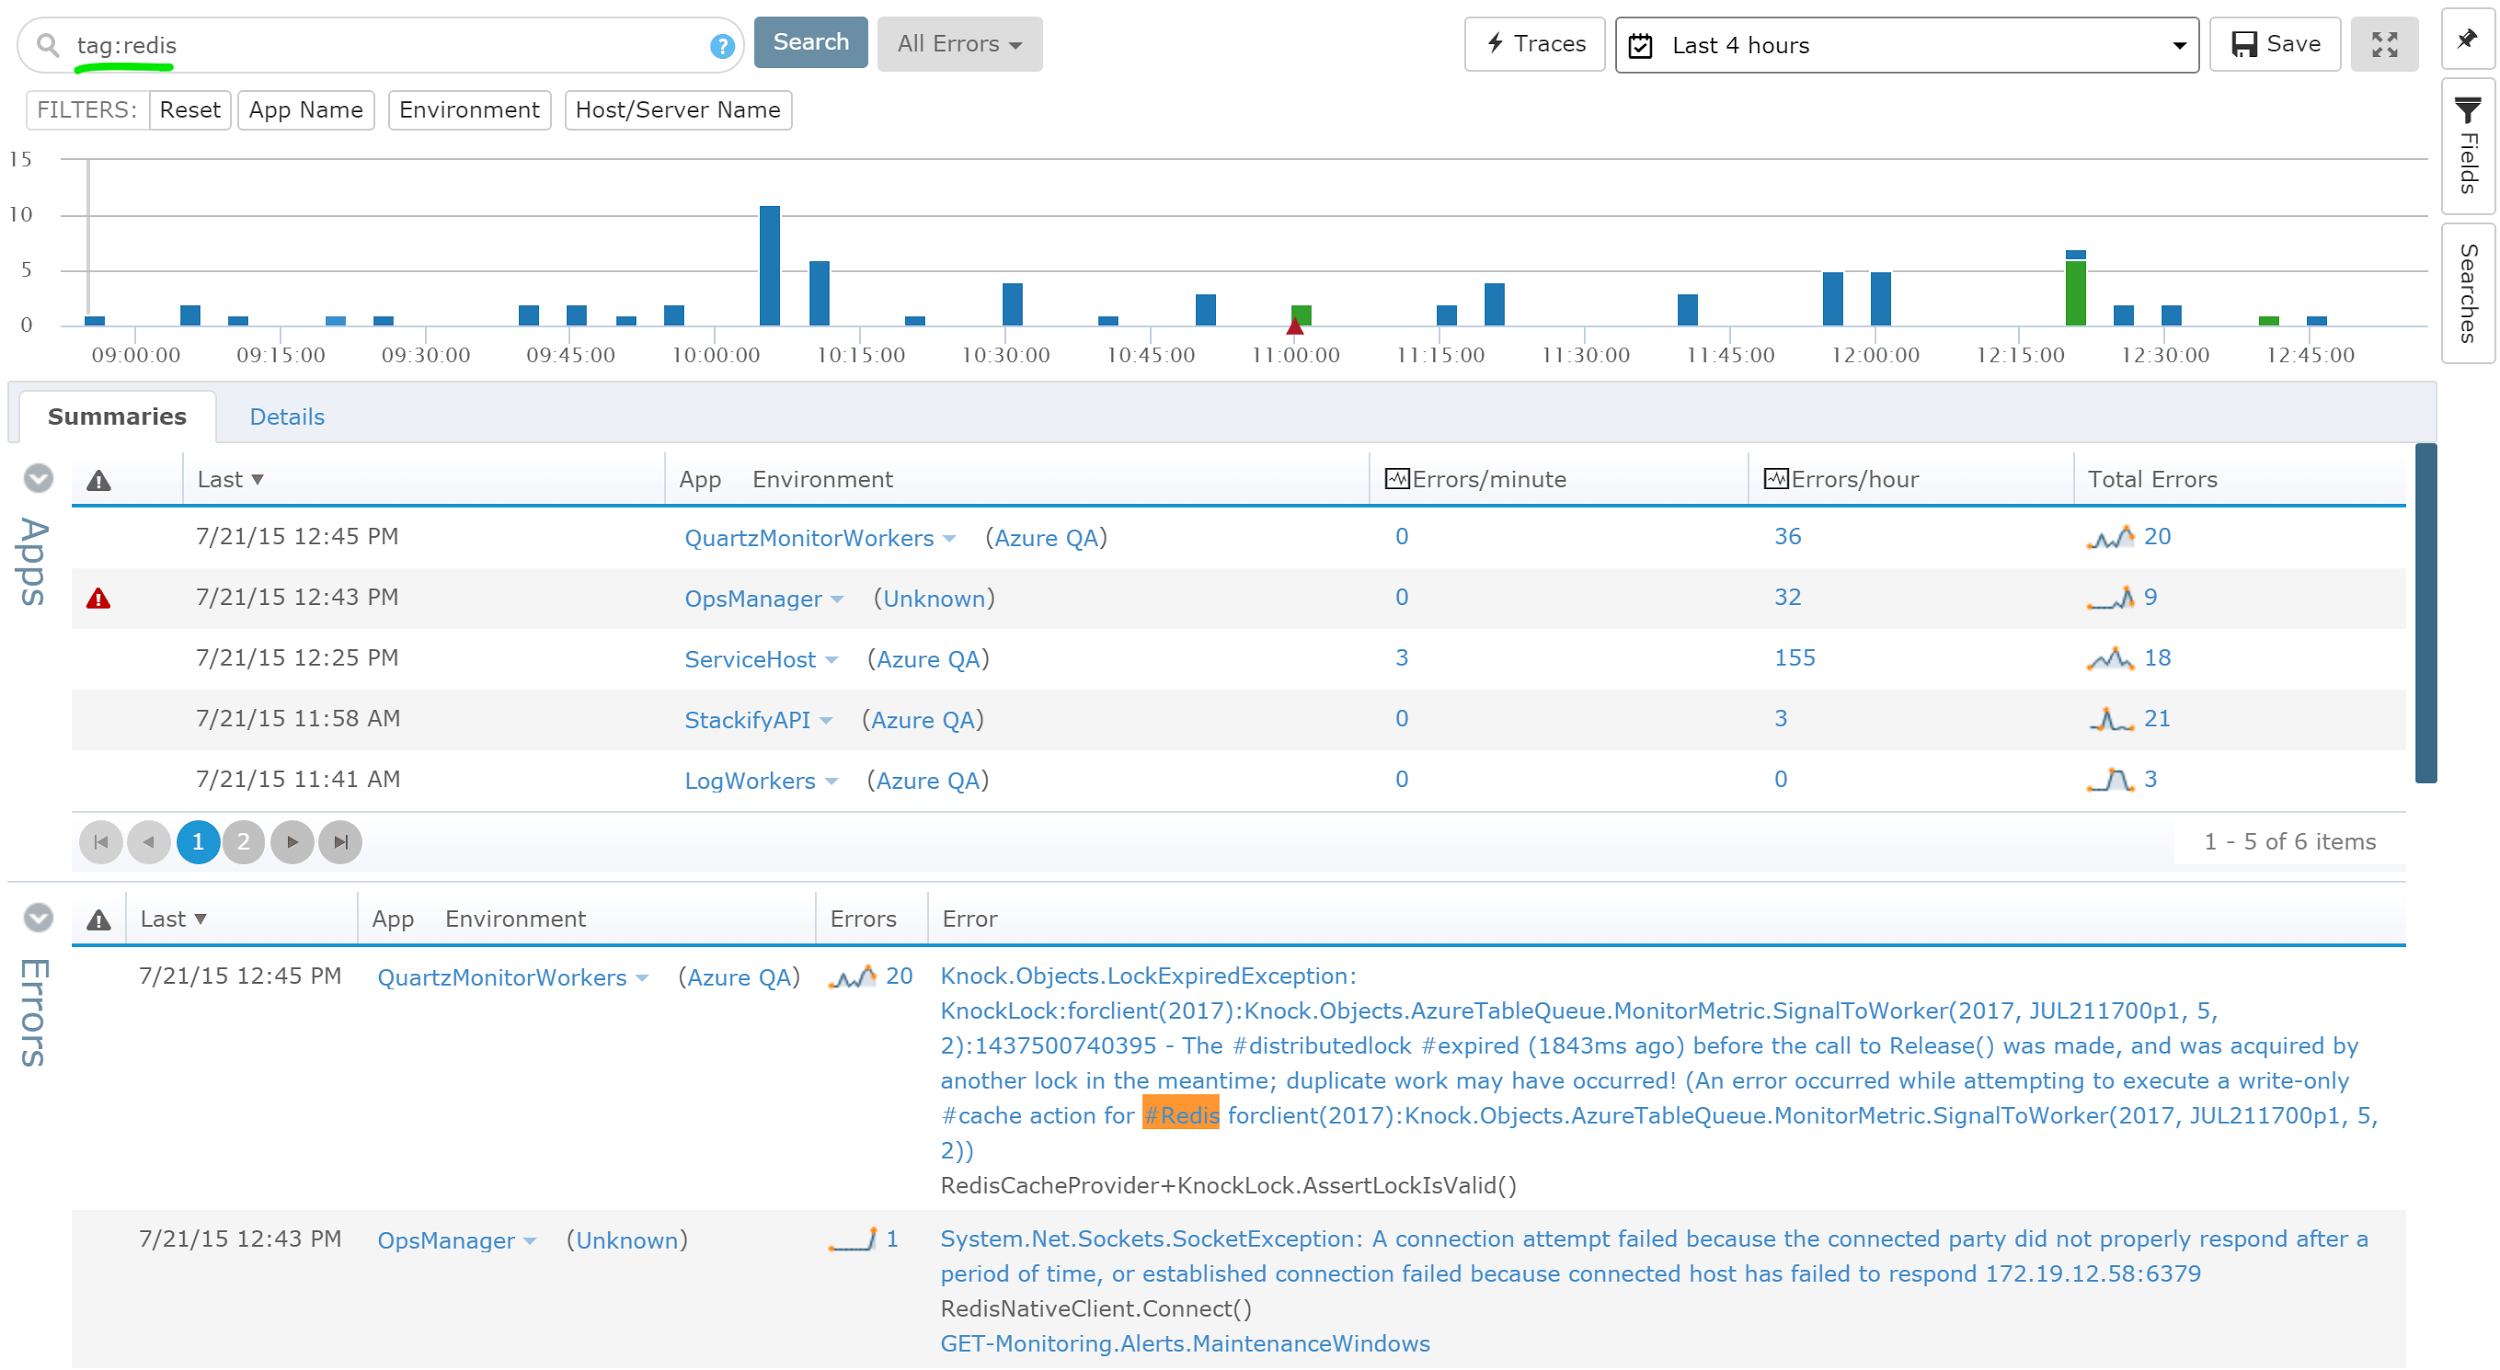
You can also search by tags on the error dashboard to see all errors containing this tag. This provides all the great additional functionality of being able to see errors grouped by app, unique error, etc.

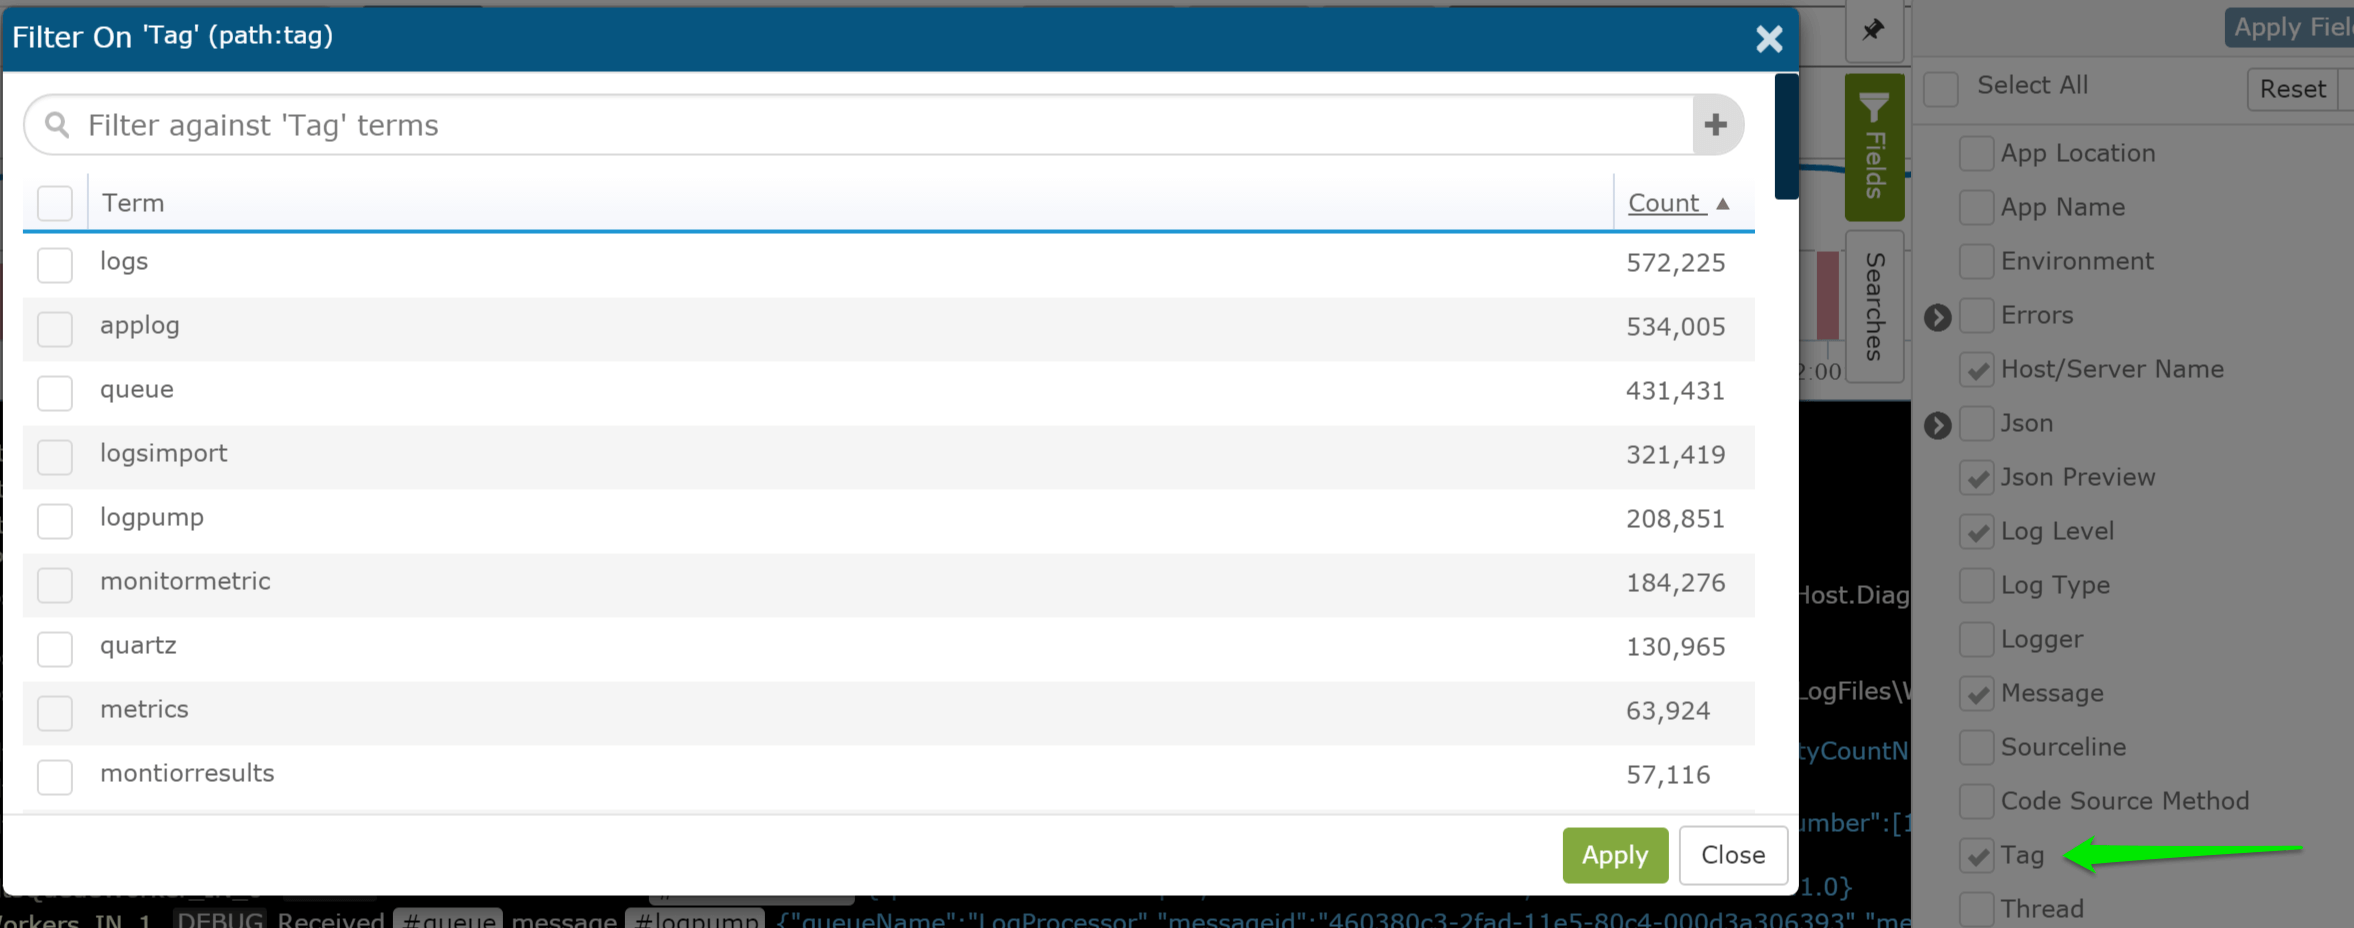
You can also use our built in field explorer to view all the tags in use and see how many times they occur. This alone can be helpful to see how many times a certain event occurs within a defined timeframe.

Tags can also be insanely useful to track a transaction across multiple apps and servers. By logging a tag for the same subsystem/subject across multiple different apps that are involved in a process, it greatly simplifies debugging. A good example of this a type of transaction that starts in a web app but gets passed via queue to some sort of background workers. Some simple tags can help link activity together across many boundaries.
To improve searching and filtering even more, we routinely include multiple tags in our log messages, often including a tag for a subsystem/subject, one for the operation, and one for state (e.g., #api #validatekey #failure). By following this convention, we can open up a range of options to quickly identify the log statements we care about. We can can get a broad view of all failing API operations via “#api #failure”, look at all “#validatekey” operations, or isolate this single event by searching for all three.
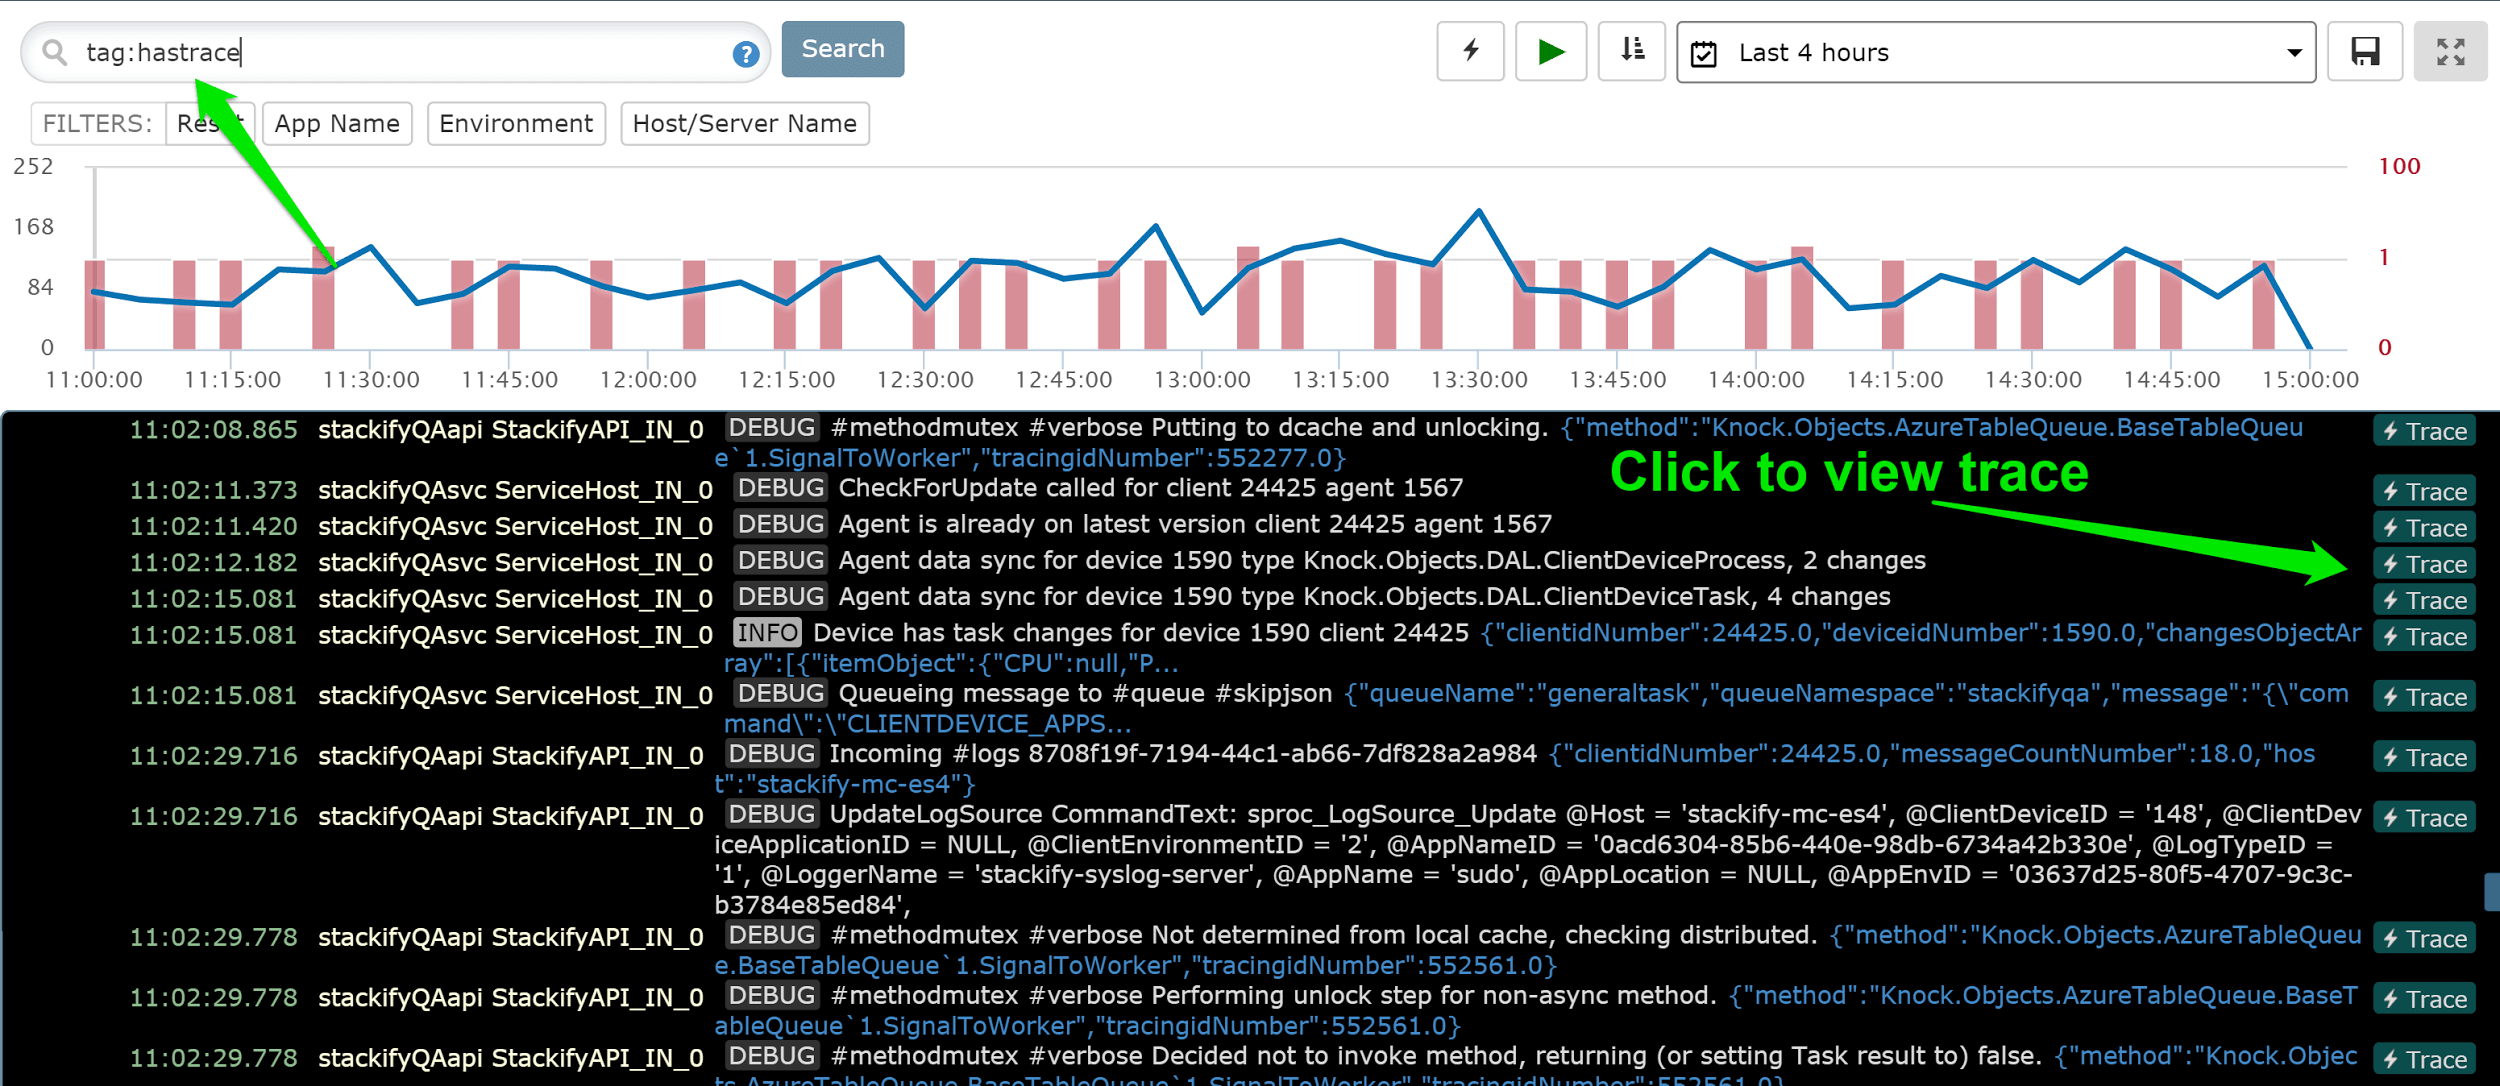
Stackify also adds some special tags to your log statements. One great example of this is the #hastrace tag. This is used to help link APM profiling traces to the logging statements that occurred in the trace. This is an amazing feature to use from our log viewer. If you identify an interesting log statement, you can look for the “Trace” button to see the actual code profiling trace for that request. Learn more about Stackify APM.

One of the real powers of tagging occurs when you combine it with Stackify log monitoring. The combination of tags and log monitors make it easy to maintain a high situational awareness for your applications, ensuring you always know if, when, and where your software is misbehaving.
To set up monitoring for your tagged log statements, go to Monitoring -> Log Queries and the Add New button. You can select a saved query or enter a new query. You can control how often the monitor runs, how far back in time it searches, and what the alerting thresholds are. For example, let’s pretend I wanted to be notified whenever my app has logged more than 500 entries containing “#api #validatekey #failure” in a 5 minute window. I could also change the monitoring alert duration to 15 minutes if I only want to be alerted if the problem persists for a length of time.
As you can see, tags provide a fast and direct way to get straight to the heart of the logs you care about. More importantly, they provide a reliable and powerful filter to combine with log monitoring to ensure that you can be proactively notified when something in your app needs a closer look.
Stackify's APM tools are used by thousands of .NET, Java, PHP, Node.js, Python, & Ruby developers all over the world.
Explore Retrace's product features to learn more.
If you would like to be a guest contributor to the Stackify blog please reach out to stackify@stackify.com