By TechnologyAzure and AWS Monitoring
By IndustryIntegrates with your stack
By InitiativeEngineering & DevOps Teams
TechnicalIt’s easy to get the help you need

One of the great features of ASP.NET is all the metrics available via Windows performance counters. There is a wide array of them available between IIS, ASP.NET and .NET. This guide on ASP.NET performance counters will review some of the top counters you need to know about and why they are valuable. We will also talk about how to monitor them with Retrace.
Special Note about .NET Core
Windows performance counters are available for all ASP.NET applications running the full .NET framework on Windows. Sadly, they do not work with ASP.NET Core utilizing the Core CLR (netcoreapp) because performance counters are not cross-platform. To learn more about this, please check out this blog post on the topic.
To simplify things a bit, I am going to split the performance counters up into a few different categories.
This is actually a complicated subject. You potentially want to track CPU and memory for your server, an IIS application pool, and your application itself. Since an IIS application pool can execute multiple applications, you may want to get down to that level of detail, which are different counters.
Server level
Note: This is where things start to get tricky. You have to know the process name of your counter. It is likely w3wp, w3wp#1, etc. (More on this later)
Note: For these counters, you need to know the instance name of your application. They should be something like _LM_W3SVC_1_ROOT_AppName. (More on this later)
There are several different counters that are helpful to track how much traffic your web application is getting. Things like the number of requests, the amount of data, etc.
It is really common for an application to have high exception rates that nobody knows about. Problems can be hidden deep in your code. By tracking these counters, you can get visibility into these types of problems. I highly recommend monitoring these.
The number of collections is useful if you are having problems with garbage collection and need to track how often it is occurring. I highly recommend always monitoring “% Time in GC” as it is one of the best indicators of potential garbage collection problems.
Monitoring performance counters can be really tricky. Many of them depend on knowing the name of the Windows process or IIS’s w3svc name of your application.
Watch a short video on how to monitor ASP.NET performance counters.
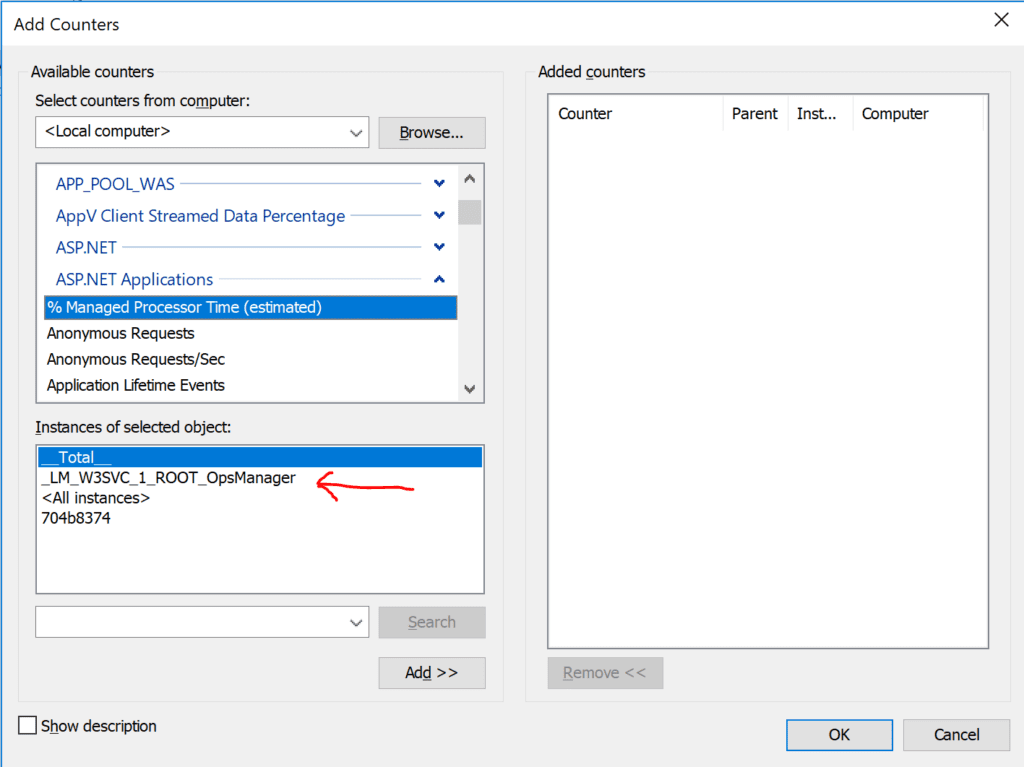
To make sure we are on the same page, here is a screenshot below showing counter instance names.

All performance counters have a category like “ASP.NET Applications” and then you have the names of the counters themselves like “Anonymous Requests”, and then you have the counter instance names.
[adinserter block=”33″]
These are based on Window’s name for your process. For IIS application pools these are typically w3wp or w3wp#1. Depending on how many application pools you have, they follow that pattern of # and a number. The problem is they can change at any time when a pool starts or stops.
These are based on the W3SVC site ID and the application path. For example, _LM_W3SVC_1_ROOT_AppName, is in IIS site ID 1, and “AppName” would be the application path underneath it. These do not change dynamically.
To find the IIS site ID, click on “Sites” in IIS manager and you can see them in table grid view.

Some counters use the name of your IIS site. For example, if it is “Default Web Site”, that would be the instance name. For example, counters under the category of “Web Service” use this pattern.
Some categories of counters use only the name of your application pool. Counters under the category of “APP_POOL_WAS” are a good example of this.
Categories like “WAS_W3WP” and “W3SVC_W3WP” use a combination of the process ID and the application pool name. For example: “40700_DefaultAppPool”
As you can see, counter instance names are a nightmare to deal with. There are multiple patterns to how they are named and the most important ones are subject to dynamically change. Process names like w3wp#2 can change at anytime and some also use the process ID.
Luckily, if you are using an application monitoring tool like Retrace, it handles all of this nightmare for you. You just tell it to monitor your application and it figures out which counters are correct under the hood.
Retrace provides robust application monitoring. This include code-level performance, custom performance counters, a custom metrics API, and of course, standard ASP.NET performance counters.
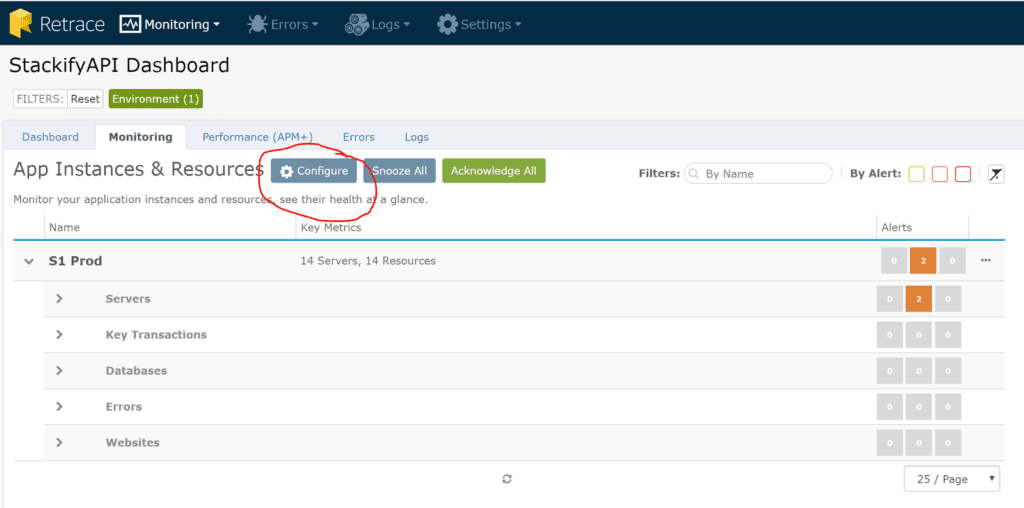
To modify how Retrace monitors your application, select your application, go to monitoring, and then click configure.

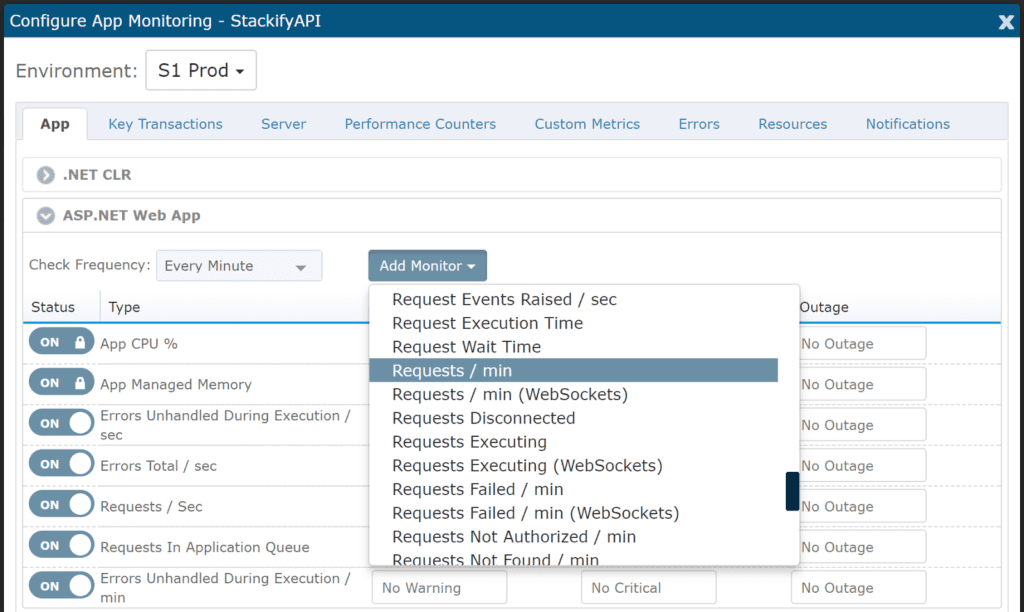
Retrace groups all of the common ASP.NET performance counters into 4 different groups.

You can expand any of these groups and select any standard ASP.NET performance counter from a drop-down list.

You can add as many as you want and Retrace will then automatically monitor that performance counter on every server your application is running on. It just works and you can forget about the nightmare of how ASP.NET performance counter instances are named.
Note: Retrace implements some smart defaults and automatically monitors several of the most important ASP.NET performance counters that were mentioned at the start of this article.
Retrace allows you to configure email and SMS alerts for any performance counter you are tracking.
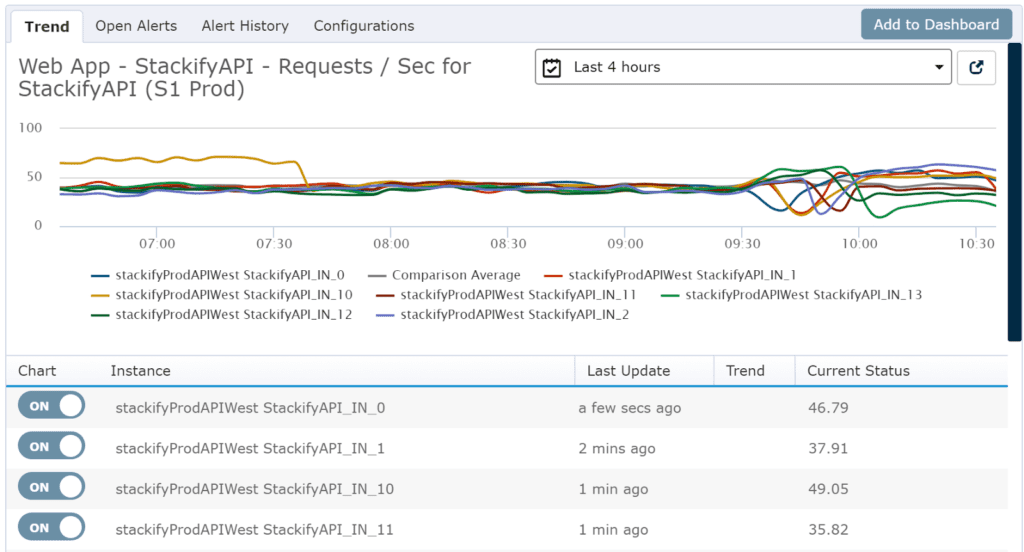
You can also easily visualize these performance counters across all of your application instances.

Performance counters are one of the best features of the Microsoft development platform. It is something that we take for granted that many other programming languages and frameworks don’t even have.
In this article we reviewed some of the top ASP.NET performance counters and how to monitor them.
Our application monitoring solution, Retrace, makes it easy to monitor the performance of your applications, including ASP.NET performance counters.
If you are researching how to monitor your ASP.NET applications, be sure to also check out these related articles:
Stackify's APM tools are used by thousands of .NET, Java, PHP, Node.js, Python, & Ruby developers all over the world.
Explore Retrace's product features to learn more.
If you would like to be a guest contributor to the Stackify blog please reach out to stackify@stackify.com