By TechnologyAzure and AWS Monitoring
By IndustryIntegrates with your stack
By InitiativeEngineering & DevOps Teams
TechnicalIt’s easy to get the help you need

Today at Stackify, we’re very proud to announce the launch of our new product, Retrace APM+.
This first release specifically targets ASP.NET, but as the platform continues to grow, support will be added for other popular programming languages. More details will be announced later this year.
Stackify Retrace builds on top of the great foundation of our current offering, known for great real-time application and server monitoring coupled with Error & Log management. Now, with this new addition, we can give ASP.NET developers the code-level insights they need to take their application performance to the next level.
In a nutshell, Stackify Retrace adds method-level code profiling of ASP.NET applications. For each request to your web app, we collect a lightweight call stack trace, that gives insight into:
Additionally, Stackify Retrace APM+ has a couple of features that are industry firsts:
All standard ASP.NET frameworks are supported.
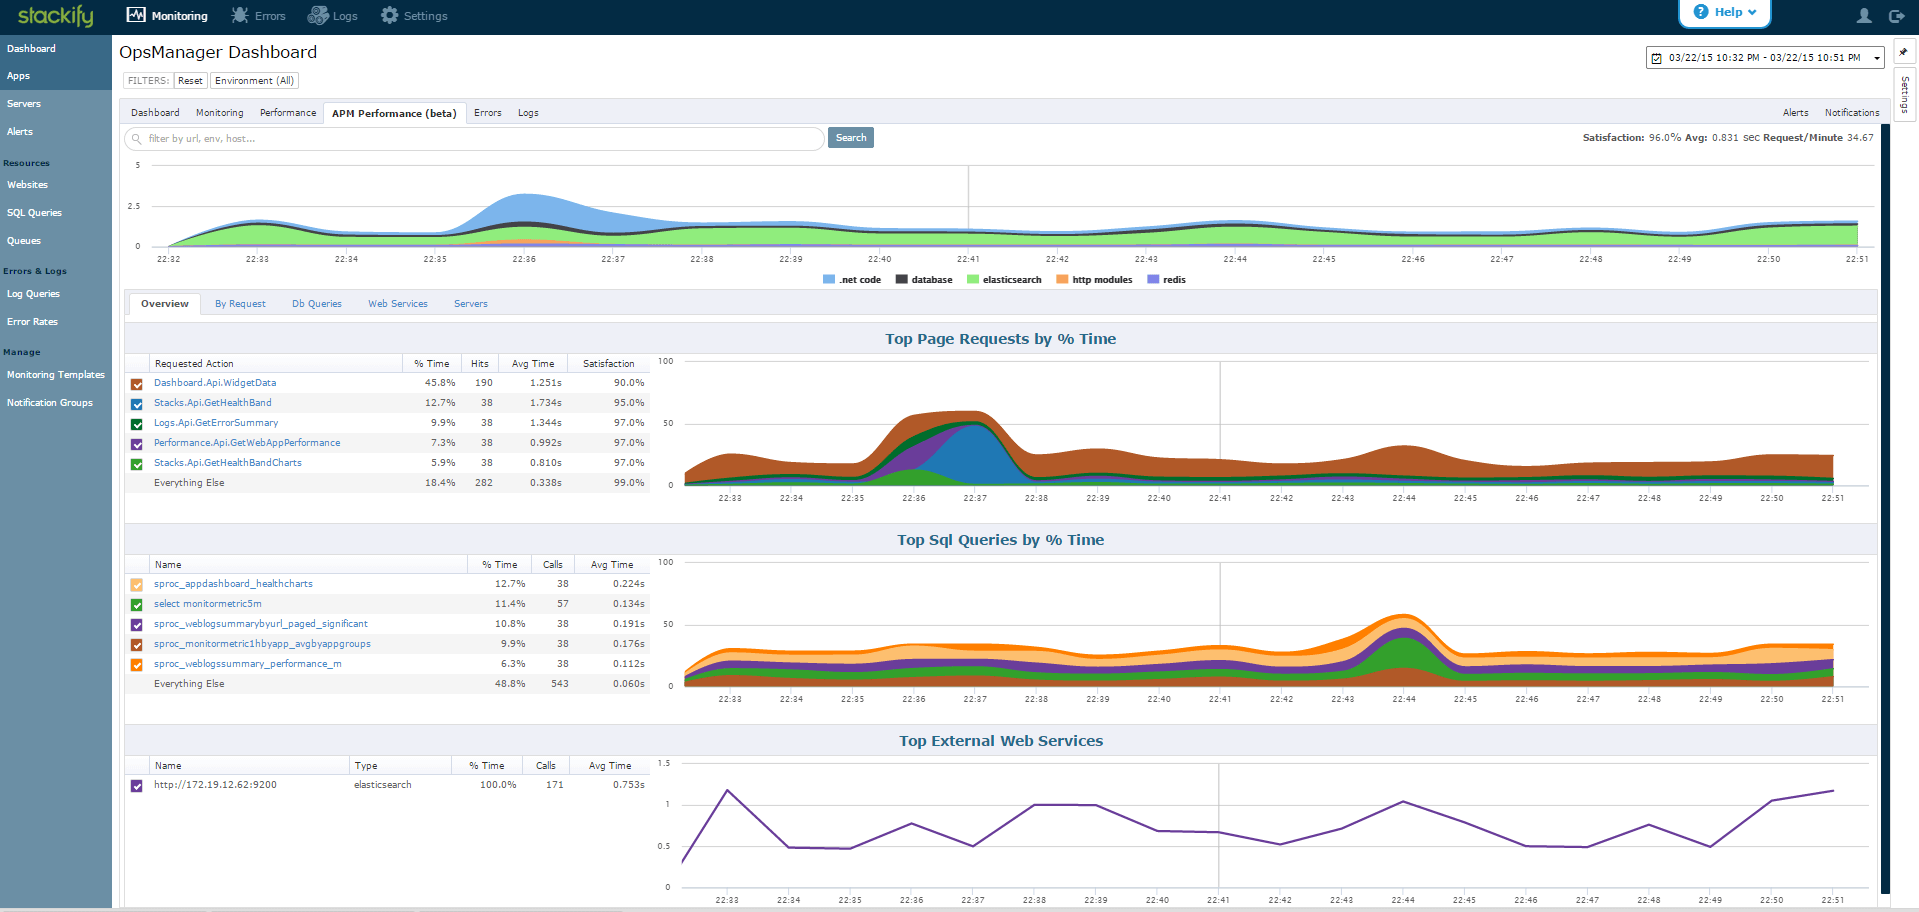
These new capabilities are integrated in to the existing application dashboard that our users have come to love which already combines server monitoring, app metrics, errors, and logs. Just click on the new tab labeled “Performance (APM+)” on the app dashboard for your app. From this view, you can quickly see:

Drilling down into any request, you see more specific details such as the call stack, how many database connections / queries are made per request. You can even look at a unique query, see what pages call that query, and any performance differences between those pages.
Do you have a key transaction that needs to perform within certain limits? Of course we give you the ability to monitor these things!
For any profiled URL, you can set up Stackify monitors for:
And for SQL queries:
This is all just the tip of the iceberg. We look forward to watching you dig into all of this great data and gain new insights into how your apps are performing. In the next few months more great features to Stackify Retrace APM+ will be released..
To read more on using Stackify Retrace APM+, check out our docs here:
Enabling and installing Retrace APM+
The .NET CLR (Common Language Runtime) exposes an API that, if subscribed to, allows a registered profiler to get callback events as the CLR executes your code. This exposes the internals of the CLR to the profiler and allows for inspection of code to occur at runtime, almost as if debugging the code. In fact, .NET debuggers all use this same API. For Stackify APM+, we’ve implemented our profiler using this API as well.
Back to the question….. will it add overhead? That’s a great question, which is addressed in this article: Is Stackify APM Safe for Production Servers.
Many .NET developers are familiar with traditional profiling tools, such as ANTS (which is a great tool!), but know that it should never be used on a production system or anywhere that performance is critical. This is because traditional profilers will profile everything, all of the time, on all threads. As it does this, it’s crunching a lot of data and statistics about memory and CPU usage.
Stackify Retrace APM is built to be lightweight and not cause performance issues, even if running on high-volume, production servers. We only profile threads serving a web request and we really limit what we profile to important events in the page lifecycle, and items known to directly impact overall performance (such as SQL,web service requests, etc).
We feel confident that most clients should be able to run this on critical systems, but do make sure you aren’t enabling on an already resource-constrained system.
In fact, we have been running Stackify Retrace APM on our own production servers for about the last 6 months. Most of these servers receive 20-30 requests / sec (our WCF services alone get 22 million requests / day), and we generally observe:
We believe that negligible performance impact is well worth the insights that Stackify APM+ delivers; we’ve used it ourselves to improve performance in a lot of areas of our web app and services.
The short answer is that if you are using Stackify, it’s already available, if you are running Stackify v.1.4.200 (or higher) Windows agents on Windows Server 2008 or above. With the latest release (at the time of this writing, v1.4.209), there are options in the installer to turn it on; if Stackify’s agent is already installed, you can enable the feature from the server dashboard in Stackify. It’s worth noting that enabling APM+ requires an IIS restart. For more details, see these support docs.
If you are you not using Stackify yet, give it a try and sign up for a free trial
Everyone on the Stackify team is excited to hear the feedback from all of our current, new, and soon to be clients on this great new set of functionality. Stackify APM+ is the first application performance monitoring solution to combine code-level insights, error and log management, and server metrics into one consolidated platform to provide the best overall picture of your application heatlh, and is the best way to monitor for ASP.NET performance issues.
Let us know what you think!
Stackify's APM tools are used by thousands of .NET, Java, PHP, Node.js, Python, & Ruby developers all over the world.
Explore Retrace's product features to learn more.
If you would like to be a guest contributor to the Stackify blog please reach out to stackify@stackify.com