
By TechnologyAzure and AWS Monitoring
By IndustryIntegrates with your stack
By InitiativeEngineering & DevOps Teams
TechnicalIt’s easy to get the help you need

Troubleshooting application problems are difficult. It takes a lot of time. I would argue that it might be the thing that we developers spend most of our time on in the cycle – write some code – F5 – find out why it didn’t work – fix – F5…. And that’s just troubleshooting locally on your own machine. When your application is in production, it is even more difficult to find out what went wrong. This review covers how to access the various types of Azure logging. Learn where to find logs for your application, IIS, Failed Request Tracing, and others.
Traditionally, you could RDP into the server and open up the app logs, IIS logs or look at the event logs to get a hint of what went wrong. But where can you find that information if you are running your app in the cloud? Things are different in the cloud – there may not be a server to log into.
The cloud is different from traditional hosting environments when you use Platform-as-a-Services (PaaS) services, like Azure App Services:
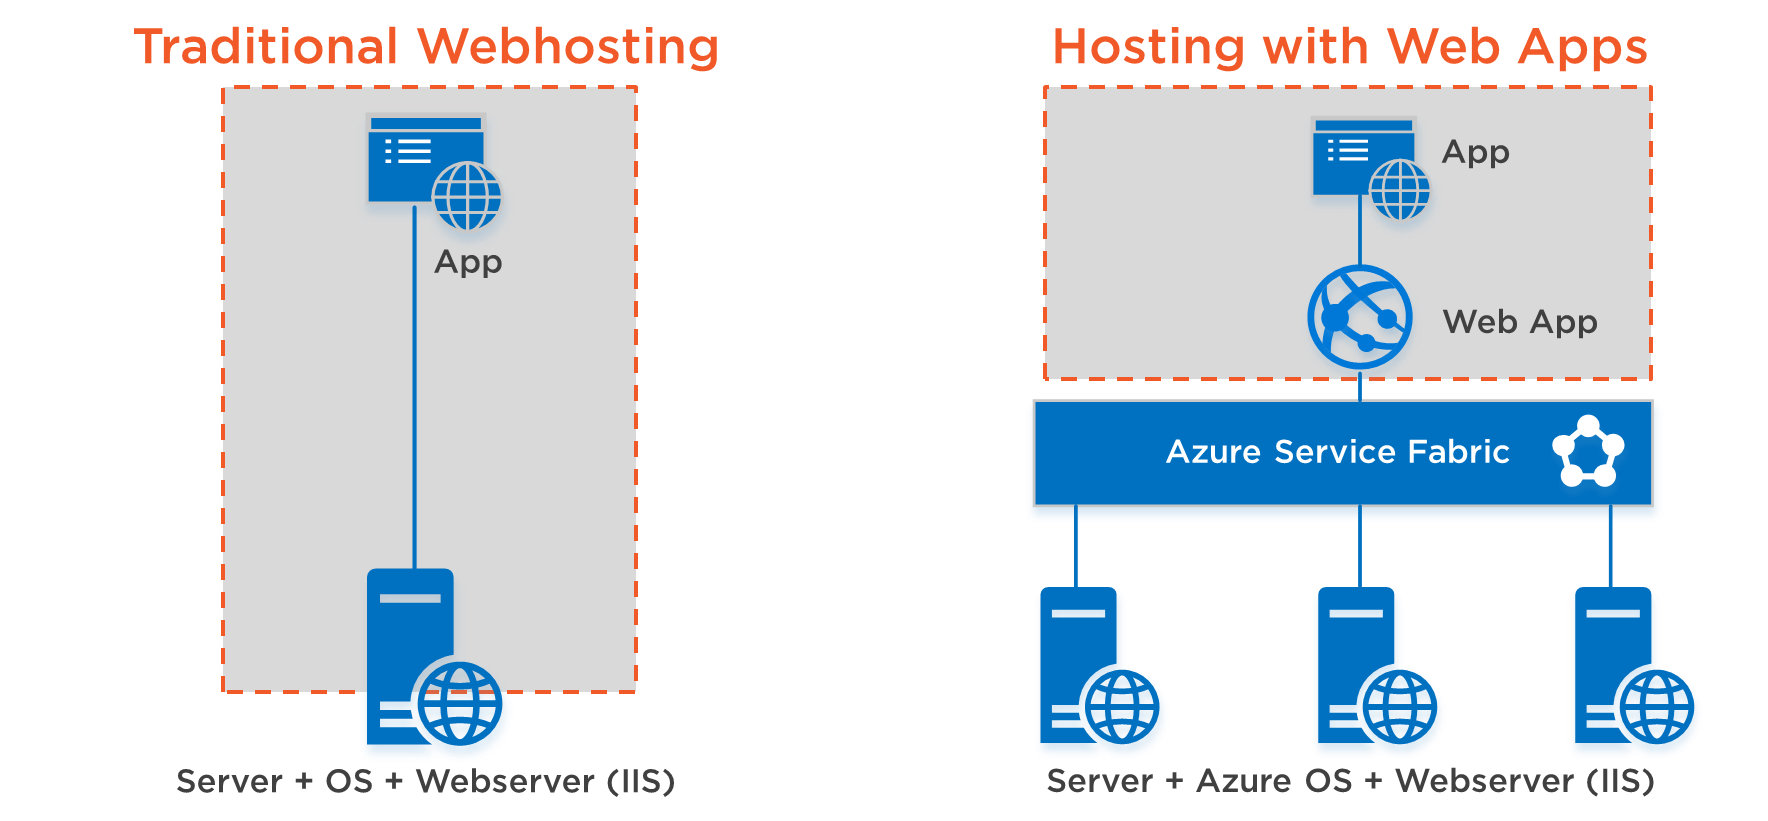
Suppose you are hosting a web application. In “traditional” web hosting, you would have a server that runs an Operating System (OS) like Windows or Linux and runs a webserver to host your application, like IIS or Apache Tomcat. You as a developer would be responsible for the application, but sometimes also for parts of the OS and the webserver. For instance, for making sure that the right IIS modules are installed, or setting the correct access rights on an application pool. This also means that you can log in to the server using RDP and troubleshoot.
When you host your application in the cloud, let’s say with Azure App Services, things are different. There are still servers in a datacenter that run your application; you just can’t “touch” them anymore, which is a good thing. Azure runs a magical abstraction piece called the Azure Service Fabric. This is the magic that abstracts server resources for you and makes sure that when a server fails, your app keeps running on another server. It also takes care of things like scaling the underlying resources. You just manage a Web App, which is simply a container that runs your application. The Web App has settings similar to those of a web server like IIS or Tomcat and that’s all you have to deal with – the application and the Web App.
This takes away the need to worry about the server and the OS, but it also takes away the ability to look into the underlying resources for troubleshooting. Luckily, Azure provides lots of tools to troubleshoot your application. In this post, we’ll look at the diagnostic logs that Azure provides.
Web Apps are a part of the Azure App Services offering. As are API Apps, Mobile Apps, Function Apps (that contain one or more Azure Functions) and some say Logic Apps are also part of App Services. Visit my Pluralsight course for an introduction to Azure App Services.
All of the App Services share a lot of features, including diagnostics features, like the diagnostics logs. The illustration below shows which types of diagnostics logs are available:
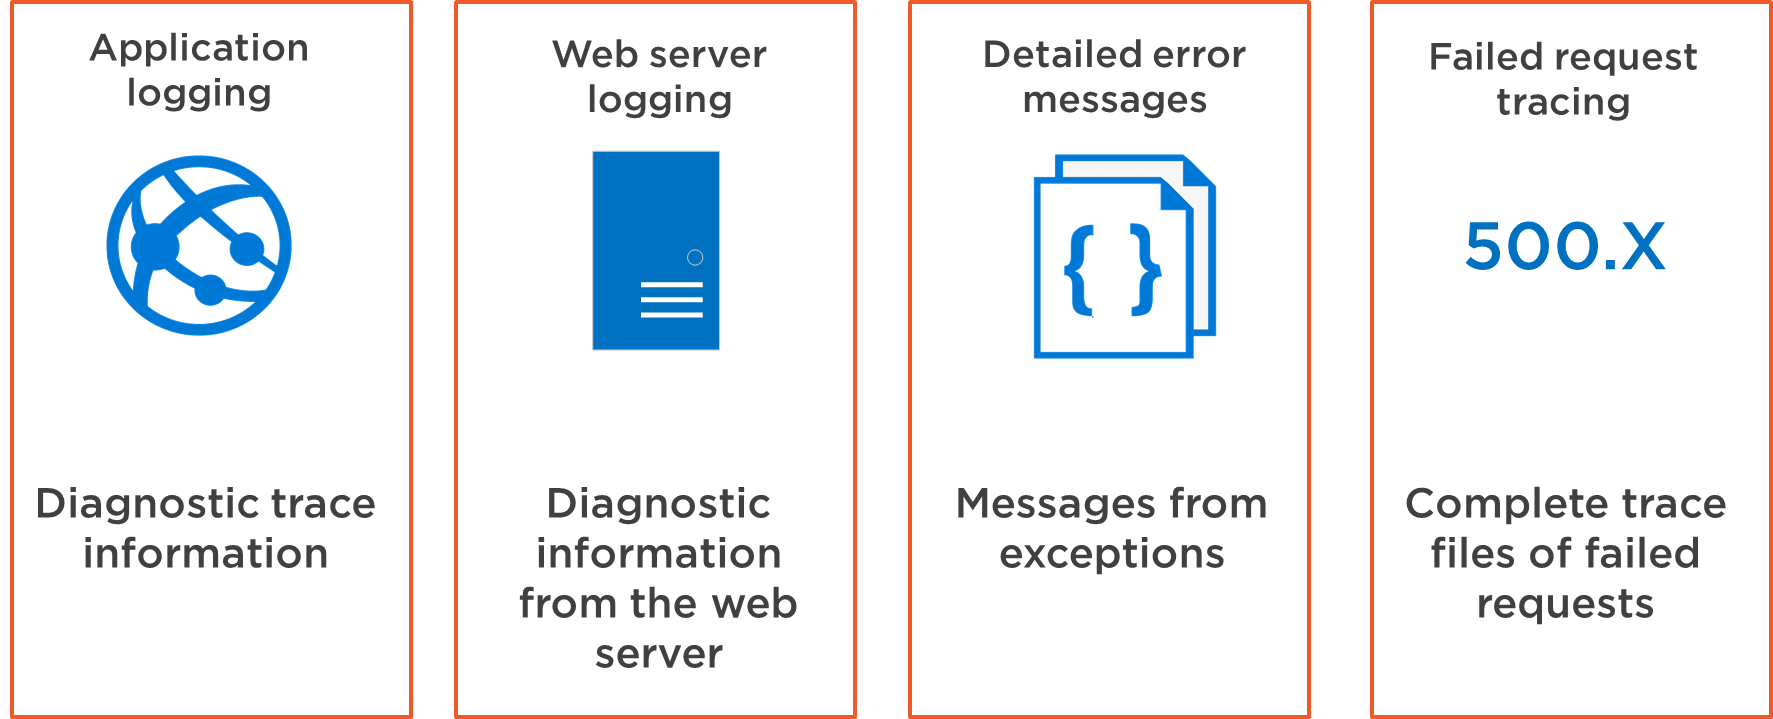
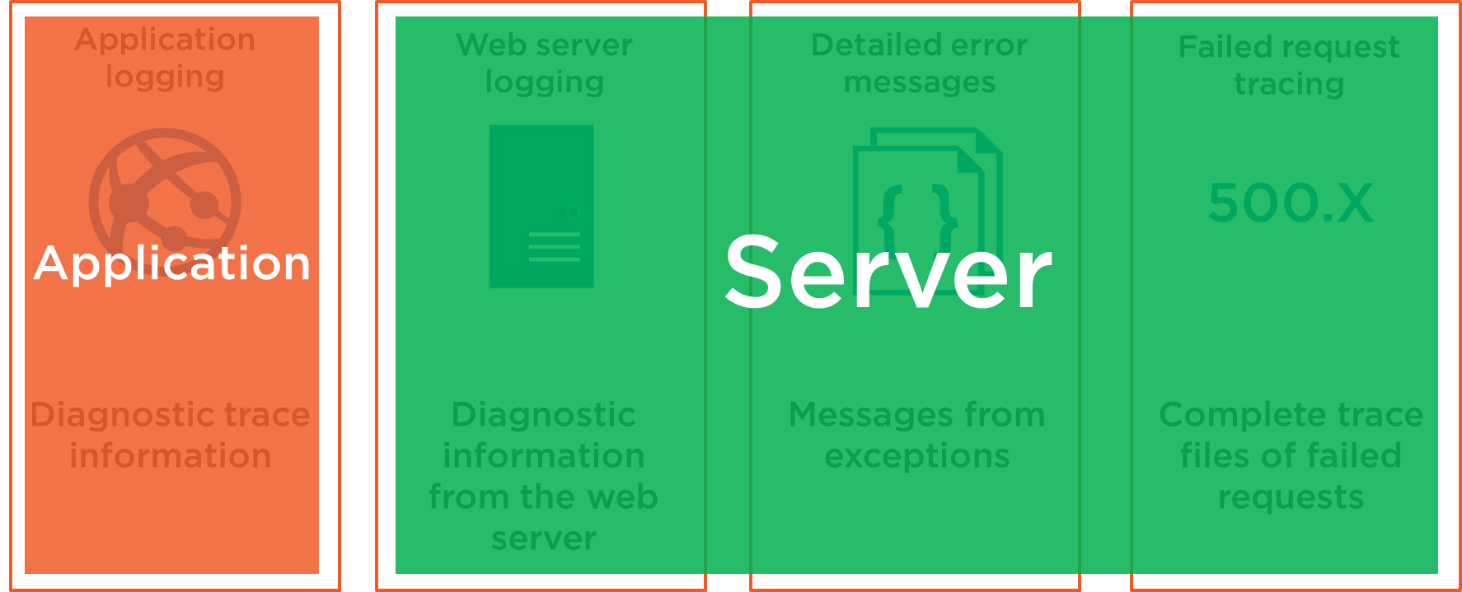
Basically, these logs can be categorized as being part of server or application logging:
You can turn on the diagnostics logs from the Azure Portal or from Azure PowerShell (using the Set-AzureWebsite cmdlet). Let’s look at how it is done from the Azure Portal:
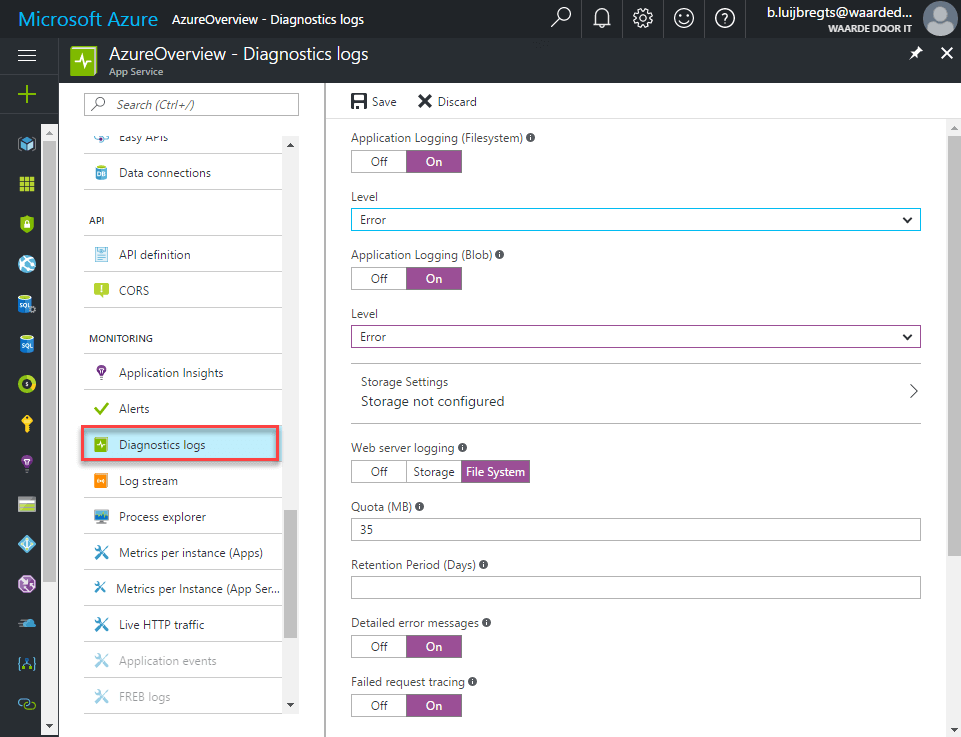
In the options of an App Service, like a Web App, there is the menu item Diagnostics logs, which opens the blade that you see in the previous illustration. Here, you can turn on the different logs and specify some options:
So we can save diagnostics logs to the filesystem. But which filesystem? App Services can have multiple instances and the resources that run them can be replaced at any time (if a VM fails, a new one will pick up the workload). Therefore, the filesystem can’t be something that lives “in” the Web App. And it isn’t. It is a bit of Azure Storage that is associated with the App Service and runs outside of the App Service process. The App Service just has this storage “mounted” as its filesystem. This is the place where diagnostic logs can be saved and also the place where the files of your application (your deployment) are stored.
Now that the diagnostics logs are enabled, we can see them and analyze them. There are many ways to access the diagnostics logs, including through FTP. Let’s go through the ones that I use most.
Streaming Azure Logs to Visual Studio
In the Azure Portal, but also in Visual Studio, you can see a stream of the logs. In Visual Studio, you can access the streaming logs from the Cloud Explorer, when you enter the context-menu of an App Service, like a Web App:
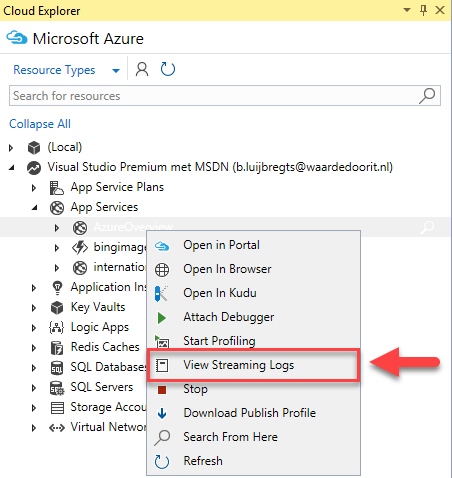
This opens the streaming logs in Visual Studio’s output window, where all the logs will be displayed:
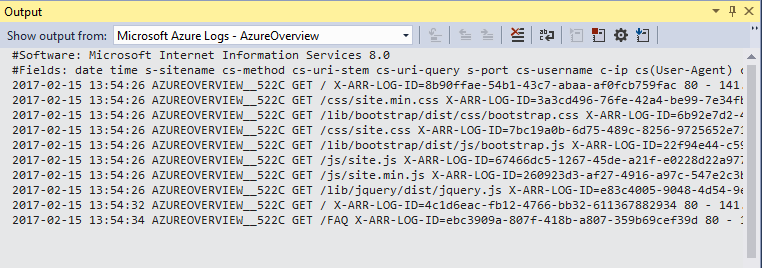
You can see all logs in the streaming logs window, except for the Failed Request Tracing Logs. This is because these are logged in XML format, and the stream can’t deal with that.
Logs in the Filesystem
You can also just look at the logs through the filesystem, or in Azure Storage if you store the logs there. The filesystem is accessible through FTP, PowerShell, Azure CLI, Kudu, but also through the Cloud Explorer in Visual Studio:
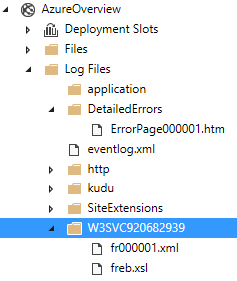
Here, you can see the log files in different directories:
You can open these logs from the Cloud Explorer and analyze them right there.
So what is in these logs? Here are some examples:
Application Logging
Application logging contains just that: application logging. This logs everything that you write out with System.Diagnostics.Trace, like Trace.WriteLine(“My message”);. These logs come in .txt format and also contain any generic information that your application spits out, like uncaught exceptions, so these Azure trace logs are valuable.
Detailed Error Messages
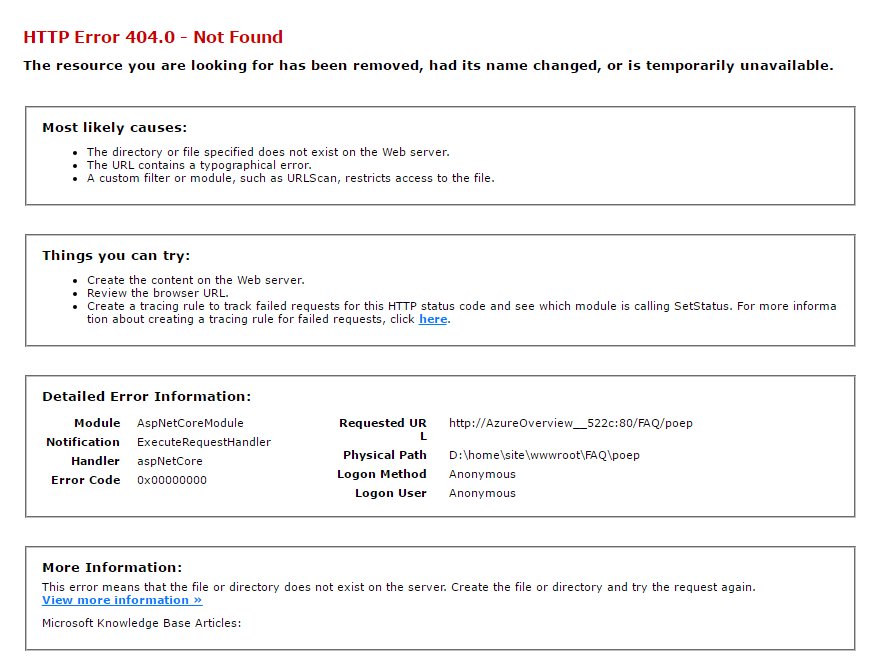
The name is a bit misleading because there is not a lot of detail in these logs. The logs capture any HTTP code that indicates failure, like HTTP 500 (Internal Server Error) or HTTP 400 (Bad Request). These logs come in .htm format and look like this:
Failed Request Tracing
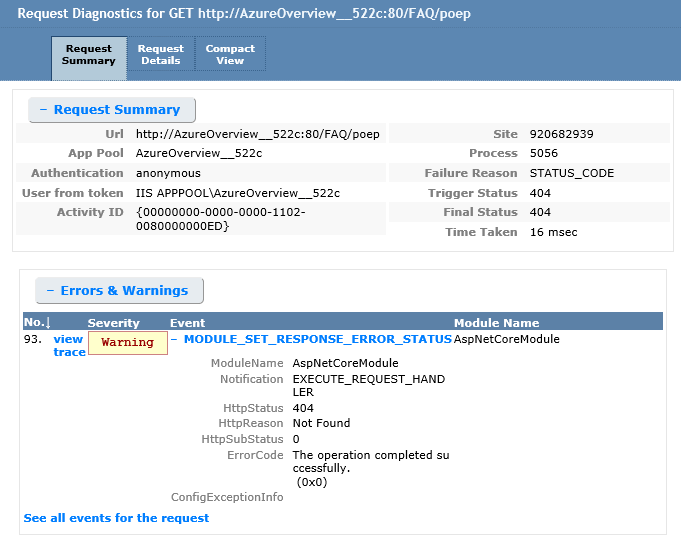
These logs are very, very detailed. Too detailed for most usage. But if you need to go deep and want to inspect every aspect of the lifecycle of a failed HTTP request, then this is the log you are looking for. They come in .xml format that has a special schema (freb.xsl). When you open them in Internet Explorer (from a directory that also contains the freb.xsl file), they look like this:
Web Server Logging
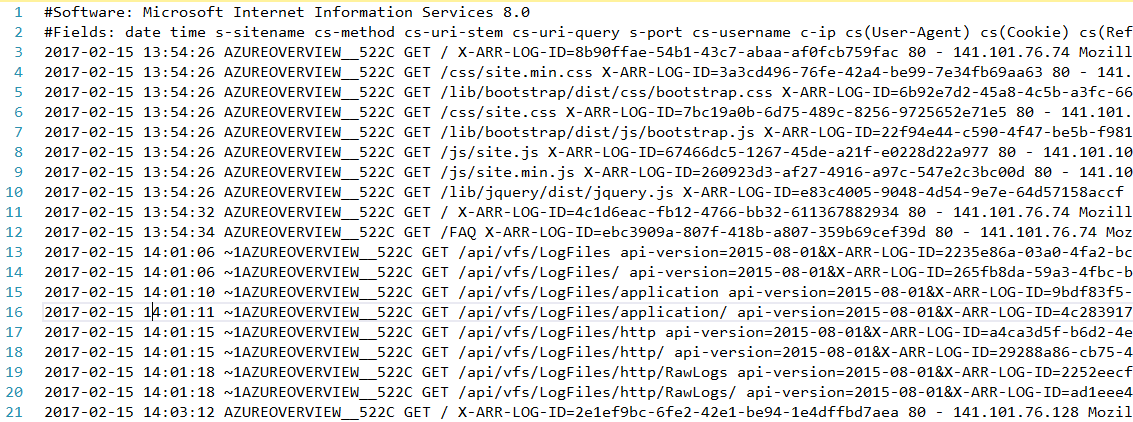
These logs contain the raw HTTP data, just like normal IIS logs. They contain each HTTP request in detail, the browser agent information, and the IP address of the requestor. Your Azure IIS logs come in .log format and look like this:
What to use when?
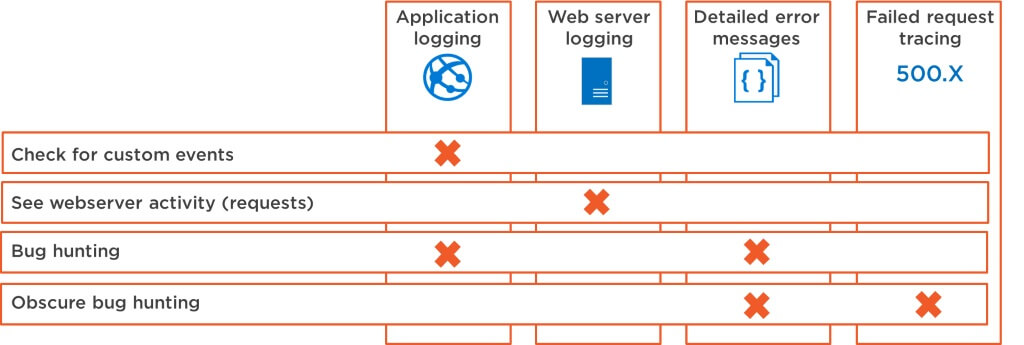
These logs can help you to troubleshoot your application, but which log types can you use best in which situation? The illustration below provides some high-level guidance:
Log files are useful and even when you are running in Azure, you have plenty of options to get information from log files.
It is difficult to get information from log files as you need to aggregate them and somehow analyze them. These are difficult problems that will slow you down when you are bug-hunting an issue in production.
I recommend using tools that visualize the information that is contained in your Azure logs. You do not have to enable the logs for this specifically as most of these tools capture this information automatically. Tools like Application Insights, Stackify Retrace or New Relic enable you to get an overview of the health of all your applications, including information that is contained in the log files and more. Using tools like these also enable you to be notified of exceptions so that you can go bug-hunting proactively.
Need help finding your IIS logs outside for Azure? Read more: Where are IIS Log Files Located?
Stackify's APM tools are used by thousands of .NET, Java, PHP, Node.js, Python, & Ruby developers all over the world.
Explore Retrace's product features to learn more.
If you would like to be a guest contributor to the Stackify blog please reach out to stackify@stackify.com