
By TechnologyAzure and AWS Monitoring
By IndustryIntegrates with your stack
By InitiativeEngineering & DevOps Teams
TechnicalIt’s easy to get the help you need
Application Insights is Microsoft’s lightweight application performance monitoring service. I have collected a nice list of things that every developer should know. Including tips, key features, and limitations.
There are some changes in the 4.6 version of the .NET framework that enables some additional data collection abilities. Be sure to update your app and redeploy it. App Insights will work with 4.5 or newer but 4.6 is preferred.
I know it sounds crazy, but you wouldn’t believe how many people have older apps written in 2.0 that they still have to support and have never been upgraded. App Insights does not support 2.0 and they don’t have any plans to do so.
If your code uses dynamic SQL, Application Insights will collect the full query and upload it to Azure. This means if the query contained personal information, credit card numbers, or anything else that could be sensitive, it is getting uploaded from your server to Microsoft.
Another thing to know on this topic, App Insights never collects SQL parameters.
Application Insights provides reporting down to the server and database name being accessed. There is no to see how long individual queries take, which is the slowest or being called the most often. There is also no way to set up monitoring for a specific SQL query.
To get a list of slow SQL queries, you would need to query SQL Server’s DMVs or use a different APM solution. If you are using SQL Azure it has some built in tuning advisor functions for this too.
Only the amount of time to execute the query on the server is included in the timings. A simple query that selects a lot of data may show that it didn’t take very long at all, but may have taken a lot more time to actually download the query results.
A simple example of of a query that took 83 milliseconds, but it took another 60 to download and iterate the results. Look for missing gaps of time in your requests. They could be caused by this scenario if they return a lot of data.

Learn more: How to measure real world SQL performance for ASP.NET
You can add Application Insights to your project and deploy it to Azure as an App Service. App Insights will seem to work, but there are some things that don’t work until you install the site extension. You can install it via the Azure Portal. I specifically noticed full SQL queries were not collected without it.
Application Insights has good reporting to group application exceptions so you can uniquely see which ones are occurring and how often.
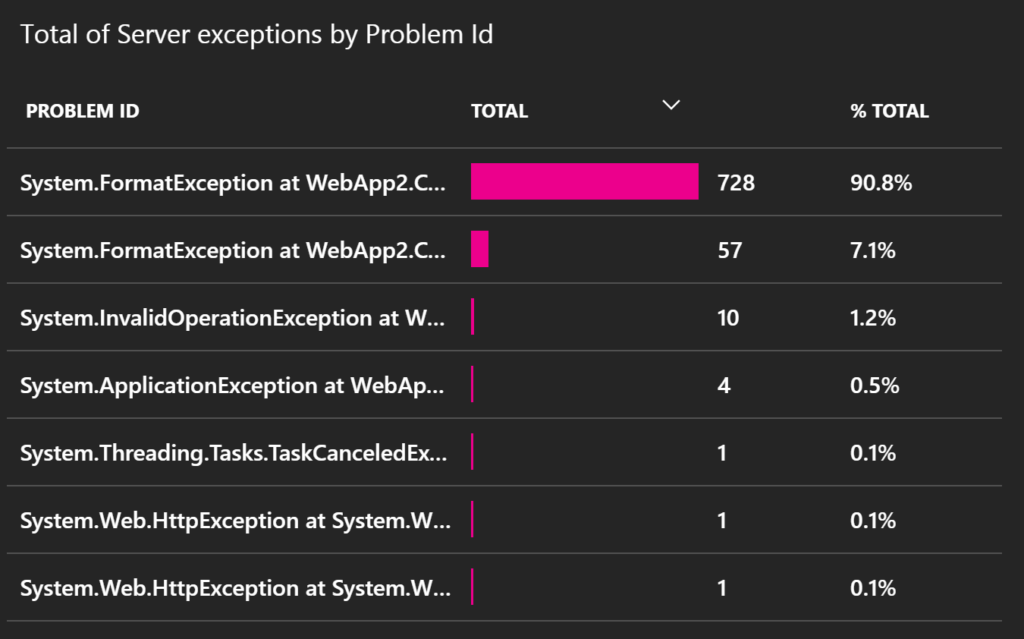
To ensure that all of your exceptions are collected you must install their SDK and make some code and config changes.
App Insights is missing some key features around exceptions. If you are having SQL timeouts, for example, odds are they impact multiple applications. App Insights has no reporting across apps to easily see this.
Retrace can collect all exceptions, including first chance exceptions, with no code changes.
Almost all new ASP.NET development is now done in async and uses the common async/await pattern. Unfortunately, it does not support the recommended way to make HTTP calls with ASP.NET.
        public async Task HttpClientAsync()
        {
            log.Debug("Starting HttpClient.GetStringAsync()");
            string data;
            using (HttpClient hc = new HttpClient())
            {
                data = await hc.GetStringAsync("http://microsoft.com");
            }

            log.Debug("Completed HttpClient.GetStringAsync()");

            return Request.CreateResponse(HttpStatusCode.OK, data);
        }
App Insights does pick up the 2 logging messages via log4net, but doesn’t show anything for dependency calls.

It does see it, it just doesn’t associate it with the ASP.NET web request. ☹
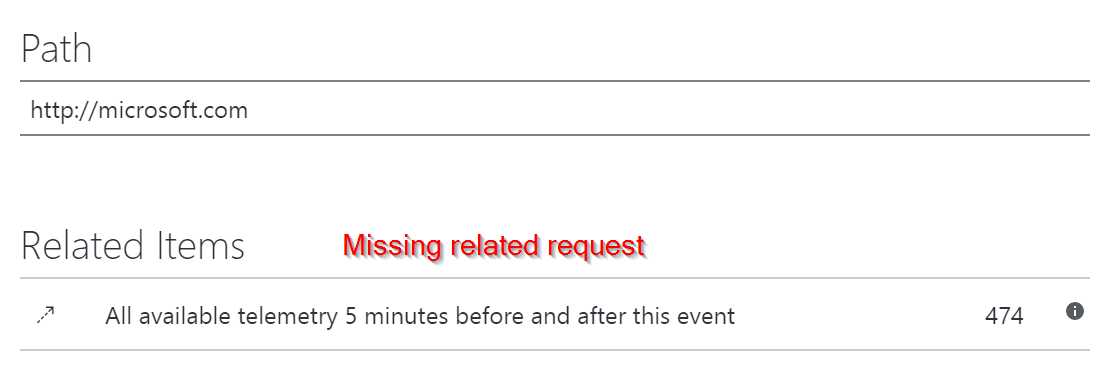
App Insights supports tracking dependency calls in your code. Microsoft’s documentation says SQL databases, HTTP calls, and Azure storage libraries are supported. Anything else requires using their SDK to manually track each dependency call.
App Insights does not support some other notable key Azure dependencies include Service Bus and redis.
Some other APM solutions, like Retrace, also support MongoDB, RavenDB, Elasticsearch, Redis, Memcached, AppFabric, MSMQ, NServiceBus, AWS services and more.
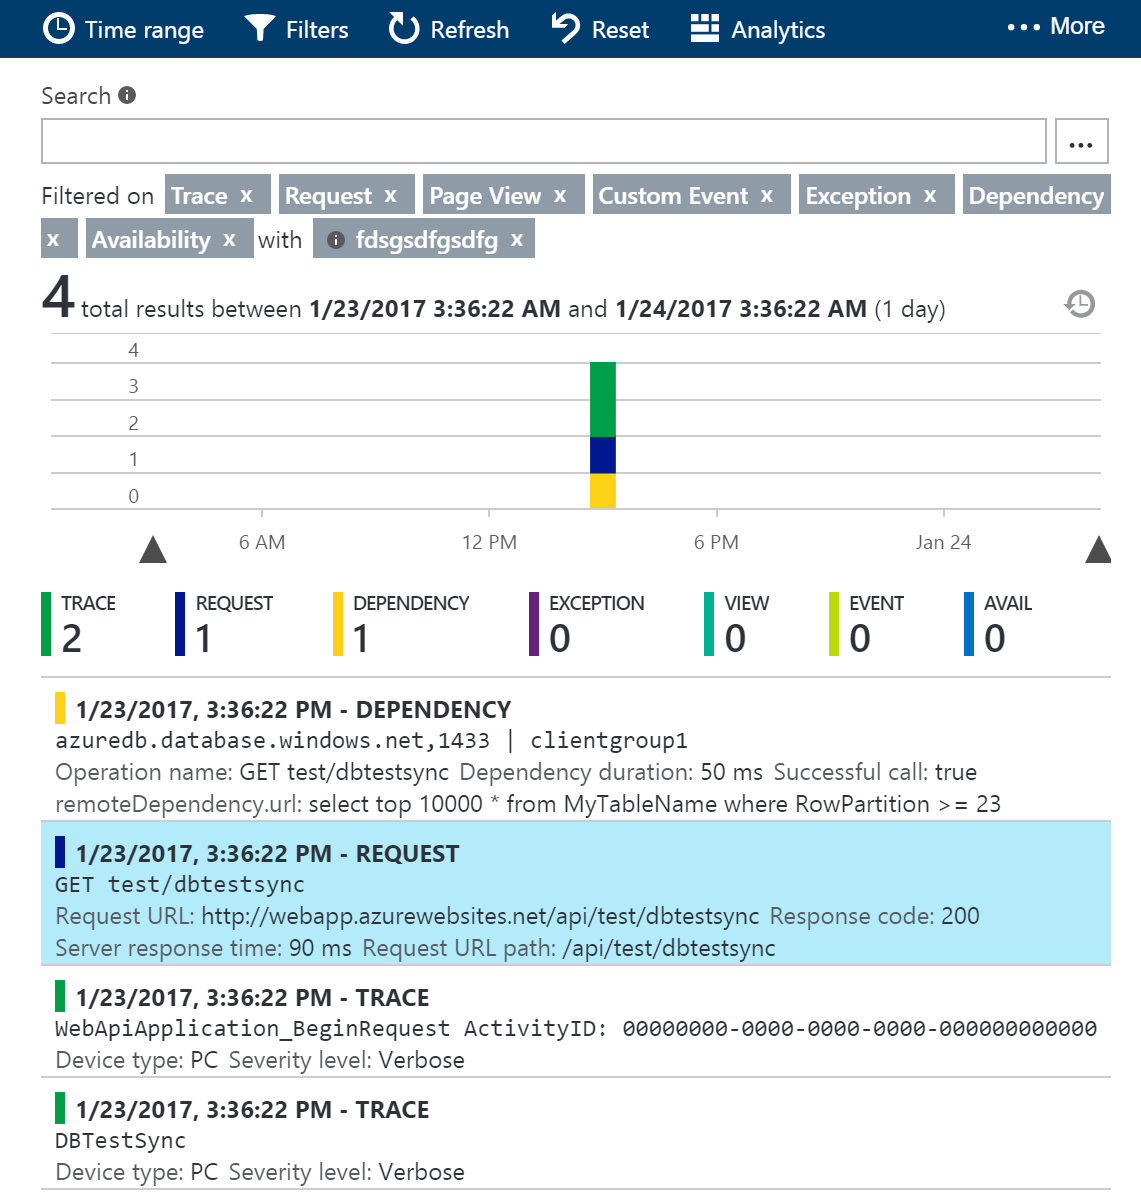
One of the key features to help track down what a request does is seeing the complete picture of logging, dependency calls, and other key events associated with a single web request.
The best way to do this in Application Insights is to click “All available telemetry for this operation”.
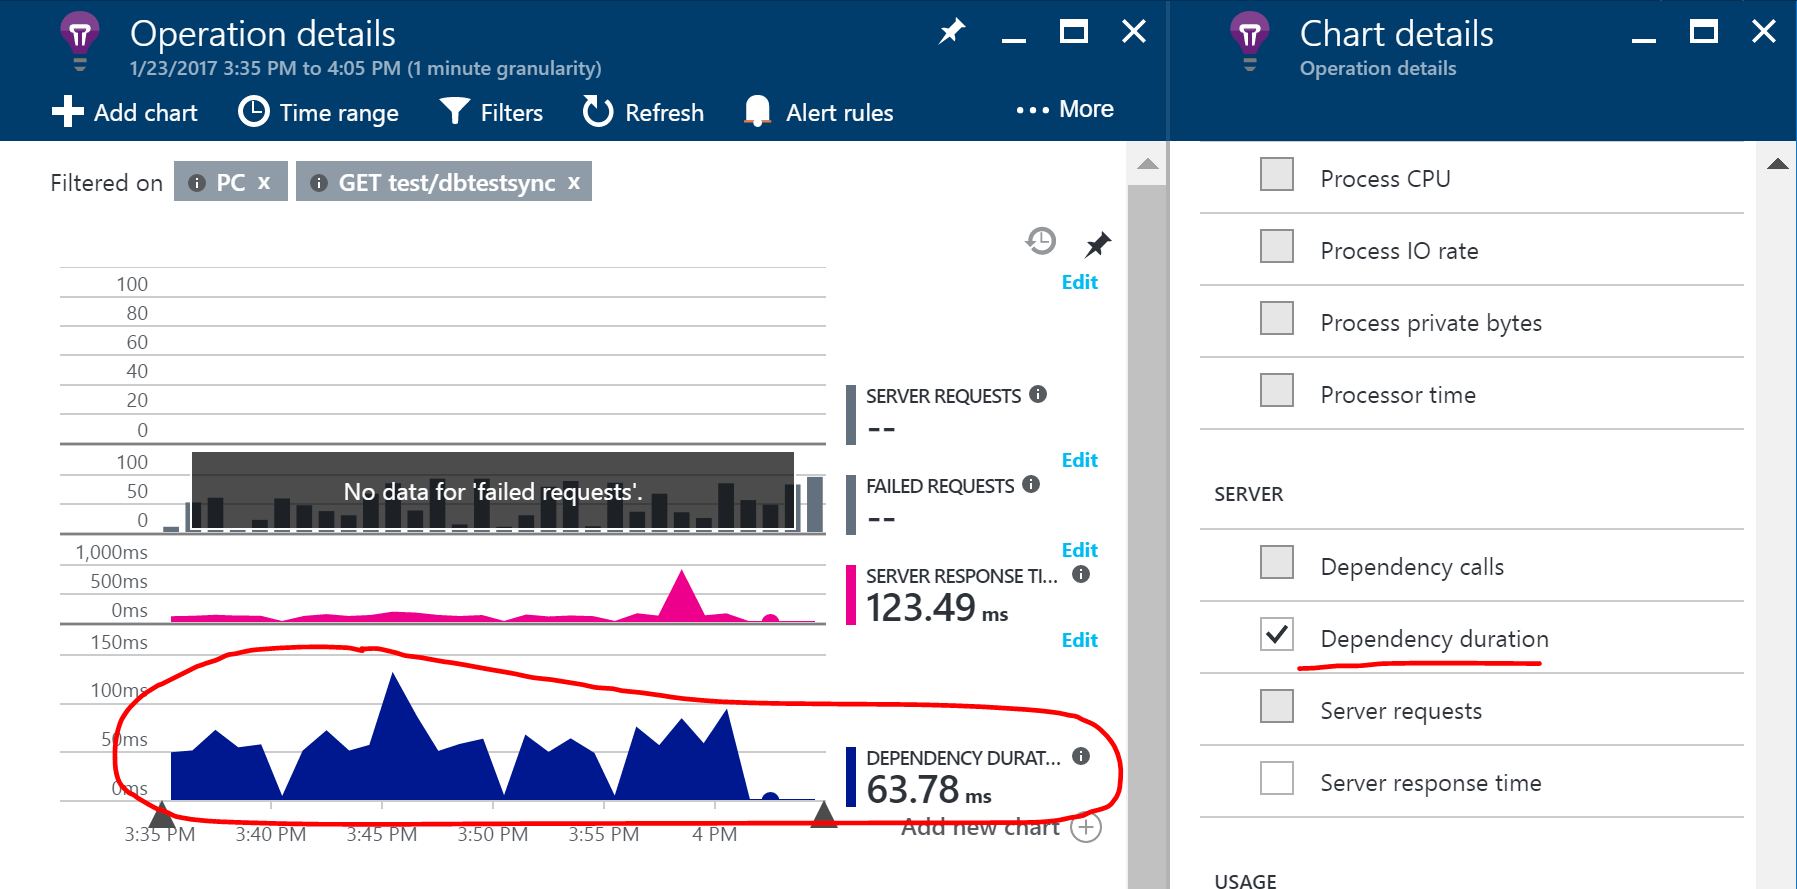
One suggestion is to customize the chart that you see when you filter for a specific operation to add the “dependency duration”. This will help you see how that compares to overall server response time.
The built-in map feature can be useful for trying to identify the performance of dependencies. It will tell you the average time and % of failures.
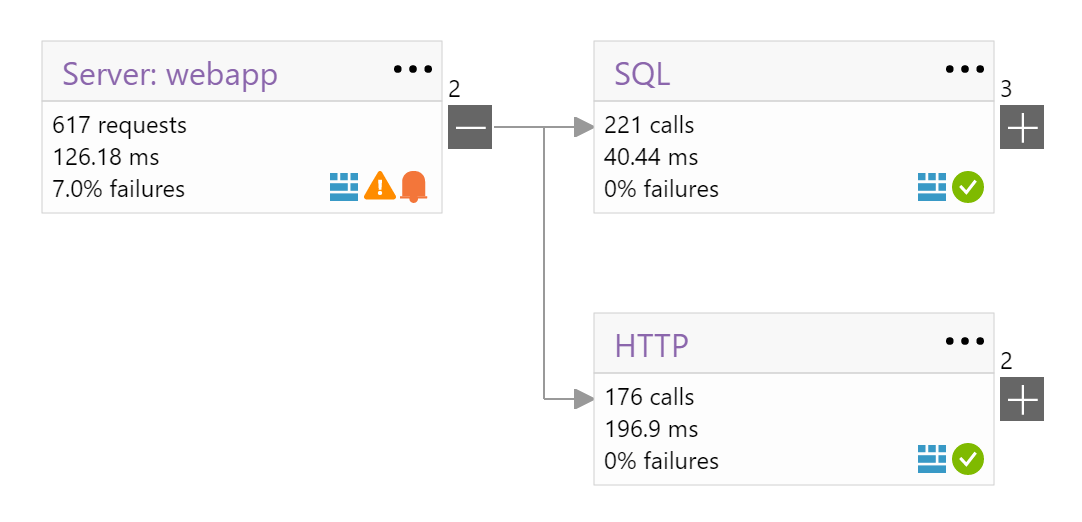
I would also suggest going to “Failures” from the menu to look for dependency failures and exceptions.
One thing that would be nice is a visual way to see how each dependency impacts overall performance. When there is a problem with one it is usually easy to see it spike.

Screenshot from Retrace
Application Insights supports configuring alerts for a lot of different conditions. Including alerting on metrics like Server Exceptions, Request Rate, Process CPU, etc.
In Azure Application Insights, each app is more or less a “bucket” that all the diagnostics about each app gets reported to. There is no easy way to see exceptions, slow SQL queries, slow web requests and etc across all of your apps. The only workaround that can provide some very minimal visibility is making a custom dashboard and selecting some widgets across multiple apps.
Within an individual application, there is no high-level way to separate out and report data by the environment (i.e. Dev, QA, Prod). Microsoft has a couple workarounds that they recommend:
Most application performance management (APM) solutions use code profiling to do data collection. Microsoft Application Insights does not use profiling. Instead, it relies on collecting data via the .NET framework via ETW and other sources.
Because App Insights does not the CLR profiler, it causes a few limitations:
Microsoft is working on some profiling features and may offer it in the future.
If your boss likes it when you spend all your time instrumenting your apps manually to report performance data, they will love Application Insights. They have a robust API and SDKs for several programming languages (.NET, Java, node.js) that lets you report requests, pages views, dependency calls, trace (log) messages, exceptions and more via their TelemetryClient.
Microsoft’s own description highlights it as being “extensible” as it relies on a lot of custom SDK usages to get rich data.
Application Insights is an extensible Application Performance Management (APM) service for web developers.
If your app uses Elasticsearch, MongoDB, Redis, or any other dependency and you would like to see it show up in Application Insights on Microsoft Azure, you will need to change your code and manually report it.
If you have a Windows Service type application that you want to track with App Insights, you will have to integrate their API into your app. Every single place you make a database call, you can simply add a couple lines of code to report the query via their SDK.
As an example, check out this article about using Microsoft Azure Worker Roles with Application Insights.
Application Insights is awesome. However, like any application, it has its limitations and best use cases. I would describe App Insights as a “light APM” solution. If you want to take the time to use their SDK, you can make it do a lot of different things.
App Insights has a Visual Studio plugin to show some data in the developer’s IDE. If you are looking for a tool to help you during the development experience, be sure to check out Prefix. It is the #1 tool for helping to optimize and prevent application problems as you test and write your code.
However, if you want the best APM available for ASP.NET developers and azure insights, try Retrace. It was designed with the entire goal of finding and fixing application problems as fast as possible. It is actually written in ASP.NET and is hosted on Azure. Monitoring Azure is our expertise!
Stackify's APM tools are used by thousands of .NET, Java, PHP, Node.js, Python, & Ruby developers all over the world.
Explore Retrace's product features to learn more.
If you would like to be a guest contributor to the Stackify blog please reach out to stackify@stackify.com