
By TechnologyAzure and AWS Monitoring
By IndustryIntegrates with your stack
By InitiativeEngineering & DevOps Teams
TechnicalIt’s easy to get the help you need

If you use PHP or you find yourself “adopting” a PHP app (like I did a few years ago), you must know how to debug PHP.
In this detailed guide to PHP debugging, you’ll see some debugging techniques that apply to almost any programming language. But don’t worry. I’ll get into the specifics that apply to PHP, from the basics all the way to fully integrated debugging techniques. Let’s start with a basic technique in PHP debugging: outputting and logging values.
When you need a simple way to debug programs and you have no other options, you can usually output values. Sometimes this means doing a var_dump or logging a whole series of events.
It’s useful to have debug logging in your program. In PHP, you can use various loggers to log debug messages. When the program is run in debug mode or the log level is set to debug, these messages will end up in your stdout, stderr, or log files. The logs will fill up pretty quickly in “debug mode,” so you only want to turn it on temporarily. But I’m getting ahead of myself here. Let me backup to some simple ways to output values.
The var_dump function is one way to see what’s happening in your PHP program. It’ll dump a variable value to stdout. There are other functions you can use for debugging through outputs. Here are a few and how they’ll help you:
Here’s sample code that exercises each of these useful debugging functions:
<?php
$myVar = "hello world!";

var_dump($myVar);
print_r($myVar);

$allVars = get_defined_vars();
print_r($allVars);
debug_zval_dump($allVars);

function sayHello($hello) {
    echo $hello;
    debug_print_backtrace();
}

sayHello($myVar);
?>
These functions are a quick way to debug your PHP code. You can see them in action in this Paiza. Each function has a purpose and can be useful for debugging.
PHP has a few ways to configure error reporting. You can use the php.ini file, if you have access to it. Otherwise, you might use the htaccess configuration. If you can’t use configuration files, you have the option of changing the values via a script. This is possible, but think about how you would change modes after deploying your application.
A combination of settings will get you the right levels of error logging. You’ll want to consider the following settings:
The PHP manual spells out these settings in more detail and provides more information I could ever fit in this section. But even with the best logging settings, you still need to monitor for errors.
It’s one thing to log errors—that’s almost a given. It’s a whole other thing to take action when errors are logged. First, you have to know about the errors. Unless you have all day and night to hover over the logs, you will not know when something bad is happening!
The best thing you can do is send your PHP logs to a service that will handle a few key things for you:
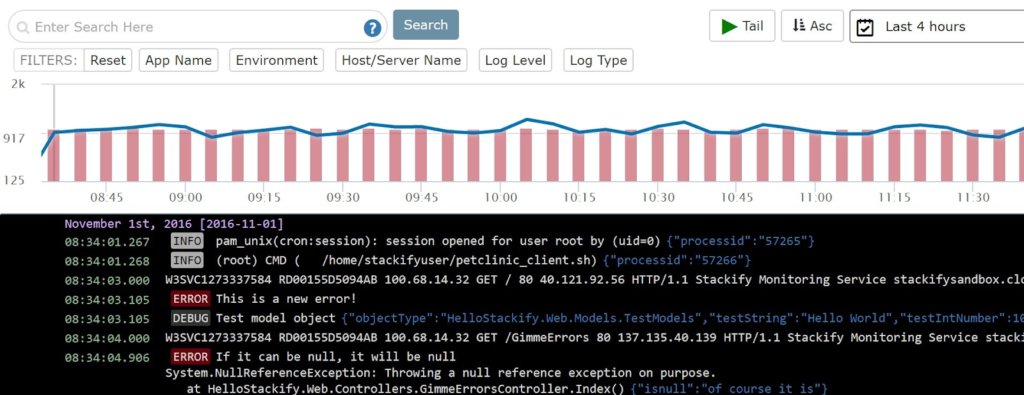
You can configure many of the PHP logging utilities to work with Stackify Retrace by following this guide. Retrace works with PHP, and it does all of these things for you. Plus, it automatically collects lightweight traces—and only when it should.
Sure, Retrace is a great tool for detecting bugs! But once you detect them, fix them. Often that means attaching a debugger. Let’s get into that next!
Now we will talk about debugging by stepping through code. This is what many of us developers think of when we see “debugging.” It’s a common way to debug code (remove defects that cause errors). With a web app or website, debugging is often two-pronged.
Once notified about an error that’s been logged, we can debug if needed. With enough detail in the logs, this should be easy. We might not even have to use a debugger. Often, the less use one, the better. But if you do, here’s how to tackle that!
You can debug PHP using one of many debugging tools to attach a debugger client. PhpStorm works with debug utilities like Xdebug and ZendDebugger.
Being a polyglot, I need an IDE that supports multiple languages, so I’m opting for VS Code these days. I’ve used Xdebug with Visual Studio in the past, so let’s see how we can set it up with VS Code.
The debug server setup is the same, but each client (IDE or CLI) will have a slightly different setup. See, the debug server (a Zend extension) opens a port, and the client communicates with the server through that port. It’s just a matter of configuration and installing the right components.
Here are the steps I’m taking on this journey:
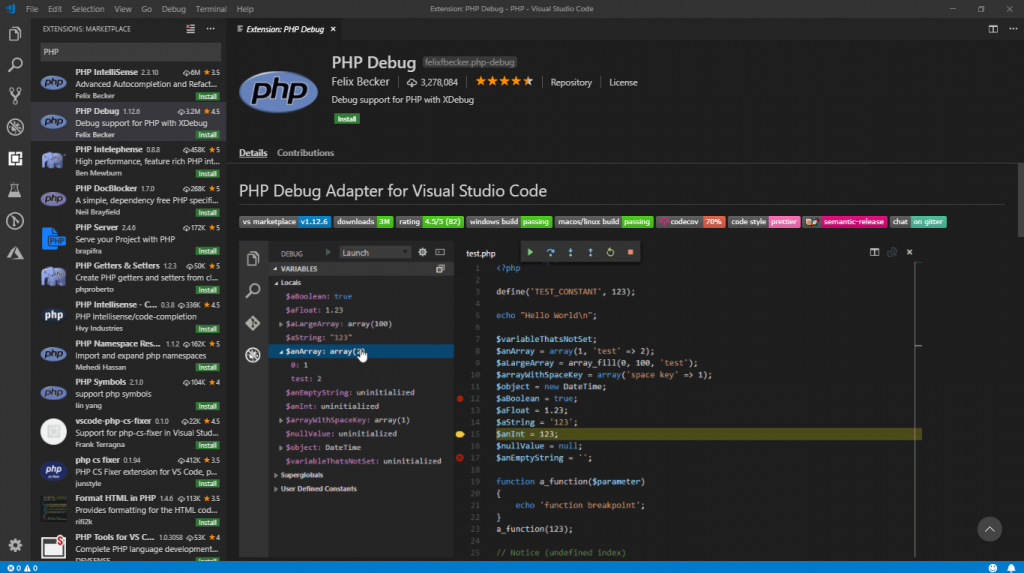 And in case you’re missing it, PHP IntelliSense is on top with over six million downloads, followed by PHP Debug, with over three million.
<?php
phpinfo();
?>
I’m looking for the PHP version, compiler version, architecture, and PHP Extension Build so I can download the correct version. I have x86, VC14, NTS (Non-thread-safe). This version came with WordPress for IIS. I’m working on a Windows machine. If you’re on a Linux box, you won’t face these same issues… just compile the source code for Xdebug!
; set the extension path
zend_extension="C:/Program Files (x86)/PHP/v7.0/ext/php_xdebug-2.6.1-7.0-vc14-nts.dll"
; allow remote debugging
[XDebug]
xdebug.remote_enable = 1
xdebug.remote_autostart = 1
This’ll set up the PHP server to use XDebug. The steps here are the same no matter what IDE you use. Xdebug opens an HTTP port so that your debugger can attach. The client still needs to be configured to attach and use the debugging protocol. I will run through that part now.
After installing Xdebug, you still need to configure your IDE to attach to the debugger. In VS Code, this means adding a debug configuration. Fortunately, this is automatic at this point. It’s just a few simple steps:
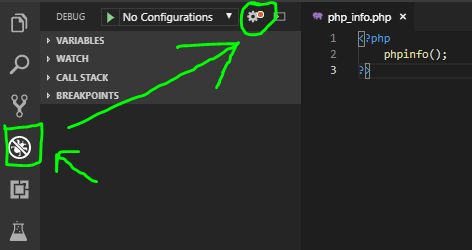


This should put our IDE in a state that’s ready to attach to Xdebug. Communications with the debugger happen through a TCP port on the debug server. Xdebug uses the DBGp protocol through port 9000 by default.
Now we’re configured, let’s look at the mechanics of a debug session. Next, we’ll cover how to get into a debug session, how to set breakpoints, and how to step through, into, and over functions. It’s the best part!
And now, the moment you’ve been waiting for: step-through debugging. We’ve already configured our environment for debugging. We’ve installed a debugging extension (specifically Xdebug), and we’ve configured our IDE (VS Code, in my case). Now it’s time to attach to the debugger.
The PHP Debug extension for VS Code generated a launch.json file. That file goes into a .vscode directory in the root of the project. Here’s what it generated:
{
    // Use IntelliSense to learn about possible attributes.
    // Hover to view descriptions of existing attributes.
    // For more information, visit: https://go.microsoft.com/fwlink/?linkid=830387

    "version": "0.2.0",
    "configurations": [
        {
            "name": "Listen for XDebug",
            "type": "php",
            "request": "launch",
            "port": 9000
        },
        {
            "name": "Launch currently open script",
            "type": "php",
            "request": "launch",
            "program": "${file}",
            "cwd": "${fileDirname}",
            "port": 9000
        }
    ]
}
It’s adding two launch configurations. Those are available in the debug view. We can either attach to a running server or launch a new one with the current script. Since I have phpinfo running already, I’ll start there by choosing Listen for XDebug to attach to that server.
Once you’re attached, you will see the debug toolbar.
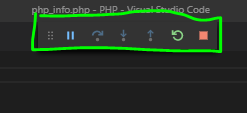
Most debuggers have a similar control mechanism. This allows you to start, stop, step, and restart your debugger. Since we see a stop and pause icon, we’re attached and ready, so let’s get stepping!
Stepping through code is as much an art as it is science. The first thing you need to do is set up a breakpoint where you think you have an issue. I’ll usually plug one in just before so I can see what’s happening as we step into the problem code. Let’s set one in the phpinfo script just to get things rolling.
Usually, clicking in the left margin will set a breakpoint on the nearest line. You can also set your cursor on the line and hit F9. If you’ve got multiple functions calls on the same line, that’s a way to ensure the breakpoint is on the right one. A red dot should appear in the left margin. This shows a breakpoint. It should also be listed in the “breakpoints” component. Here’s an image to clarify:
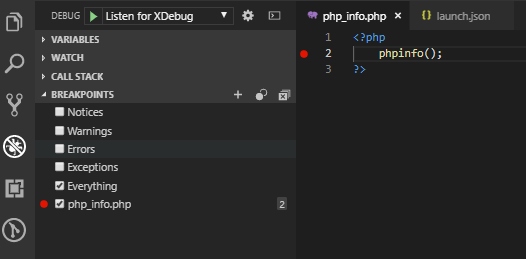
Note: we’re still in the Debug view. I set a single breakpoint. Now, when I right-click the red breakpoint circle in the margin next to the code, you can choose Edit breakpoint… to set up conditions if you need to. Conditions are useful, especially if you have an entire collection but only one element is causing an issue. I use conditionals all the time!
Besides conditional breakpoints, you have the option to log a message and break after a certain number of hits. The latter is useful when you have code that repeats without a specific unique value to trigger a break on. For example, you might have code to render components in a collection of components. If the 13th component causes a catastrophe, you can just set the hit count to 13. I’ve had to count manually too many times to see the value in this feature!
With at least one breakpoint set, you’re ready to step through your code.
Stepping through code is a complex operation. It’s simple to control, but there’s a lot going on. The debugger will evaluate variables, you can set watches on variables, and you have access to the call stack. Once the debugger is paused on a breakpoint (or by manually hitting the pause button/pressing F6) you’re ready to step through the code.
Use this script to follow along:
<?php
phpinfo();

function step_over_me() {
    echo 'stepping over me';
}

function step_into_me() {
    step_over_me();
}

for ($i=0; $i < 100; $i++) {
    step_into_me();
}

?>
You can step into functions (F11), step out of functions (Shift + F11), and step over functions (F10). You should get used to using the function keys to drive your debugging sessions; they’ll go a lot smoother if you do!
Some languages allow you to go backward in time. PHP doesn’t, but that’s OK. It’s a scripting language, and that would cause issues with declarations, anyway. Let’s step through this script by using F10.
Place a breakpoint on the phpinfo line. With your PHP server serving the page and your debugger attached, reload the web page. If all goes well, your debugger will light up and pause on that line.
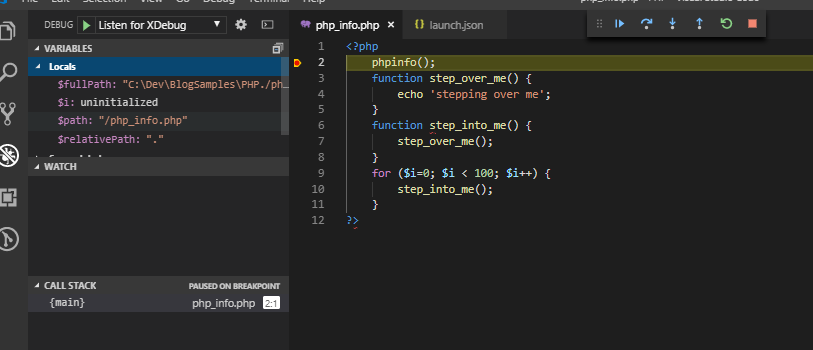
Congratulations! You now have an active debug session. Follow these steps to move along through the code:
TIP: Browser debuggers use F8 to continue since F5 is already mapped to a page reload. This little mismatch can trip you up when you switch between browser tools and your IDE.
It’s easy to skip a loop. Just set a breakpoint just past the loop and use F5 to skip ahead to that point.
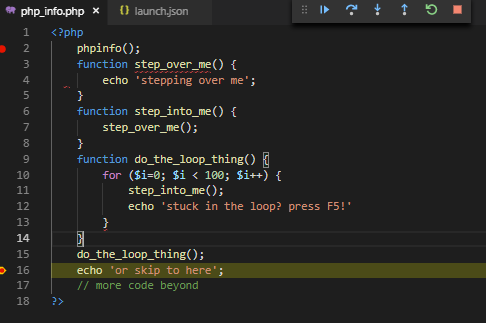
Often, you want to step into the loop at least once before you pass it by. Use F11 to step into it. Wrap loops in functions so you can step out with Shift + F11 and not lose a beat!
There’s another option, if it’s available to you. It’s run to cursor, and it does what it sounds like. Just place your cursor somewhere past the loop and use this option to jump to that point.
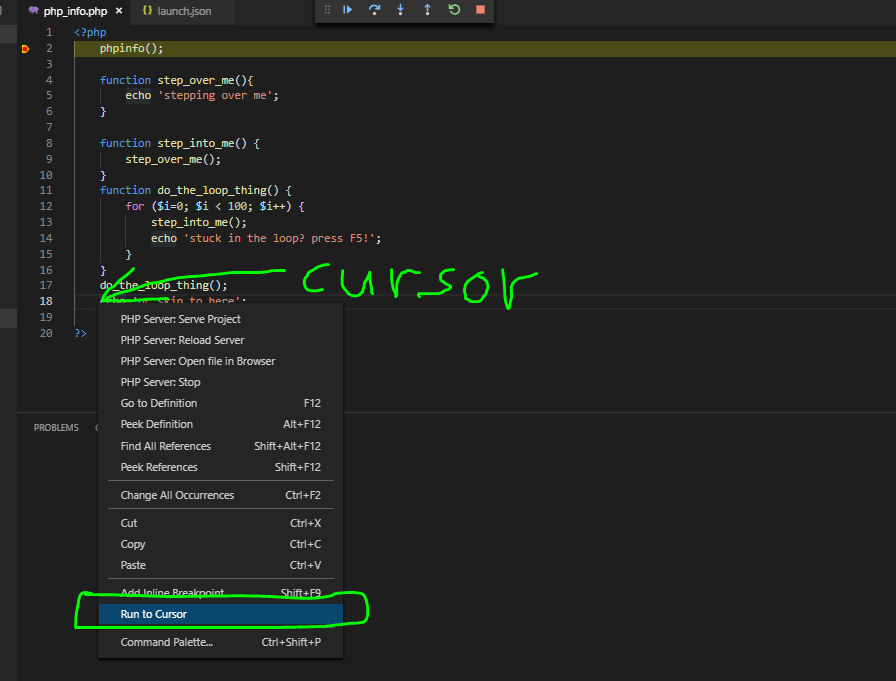
The debugger will run from its current position to the cursor when I select this option. Notice that there’s no keyboard shortcut for it, unfortunately.
One key benefit of debugging is that you can check variables as you step through the code. Most IDEs include a way to check local and global variables. Also, you can watch variables so you don’t have to hunt them down in Locals or Superglobals.
You can also watch expressions! This is great when you want to see how a complex expression inside an if statement will evaluate. Just copy the expression into a watch and you can track the result as values change.
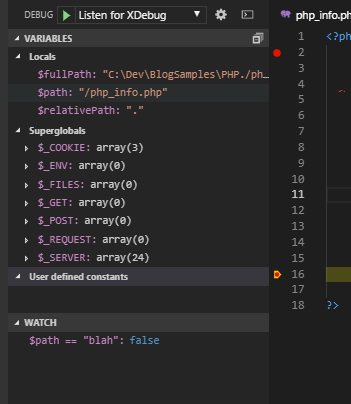
I’ve added the following watch expression: $path == “blah”. In VS Code, you can highlight an expression in the code and open the context menu to watch the expression.
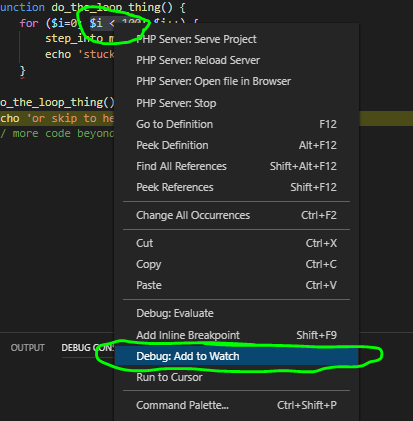
I’ve highlighted $i < 100 to add it to my watch expressions. You can also evaluate any expression in the debug console!
You can evaluate expressions in the debug console too. If you need to check something once, it’s better to evaluate it in the console.
Open the debug console and enter the expression.
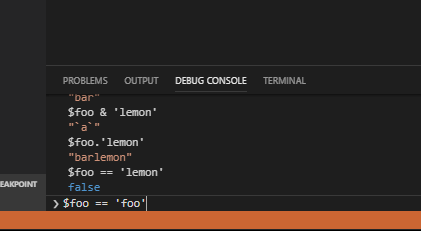
You can also check the context menu for an option to evaluate the selected expression. Here are things you can do in the debug console:
These frequently come in handy for debugging!
We’ve covered a lot in this post. It’s enough to get you started with PHP debugging. This is a highly in-depth topic, but the best way to learn is by doing. Practice debugging until you’ve mastered the technique, and you’ll earn a reputation as a bug exterminator extraordinaire!
Stackify's APM tools are used by thousands of .NET, Java, PHP, Node.js, Python, & Ruby developers all over the world.
Explore Retrace's product features to learn more.
If you would like to be a guest contributor to the Stackify blog please reach out to stackify@stackify.com