By TechnologyAzure and AWS Monitoring
By IndustryIntegrates with your stack
By InitiativeEngineering & DevOps Teams
TechnicalIt’s easy to get the help you need

When you spend a long time building an app or website just to have users complain about latency issues, it is not fun.
You don’t know where the problem lies, nor do you know the environment in which it occurred. So it gets ignored, and performance issues keep lingering, like a haunting memory. This not only wreaks havoc on the end users, but your bottom line suffers as well. Users don’t want to spend time on a site that is slow.
The division of web performance monitoring tools tend to be based on which big question they answer: “How fast is it?” and “How can it be faster?” The two classifications of tools are commonly referred to as synthetic and real-user monitoring (RUM).
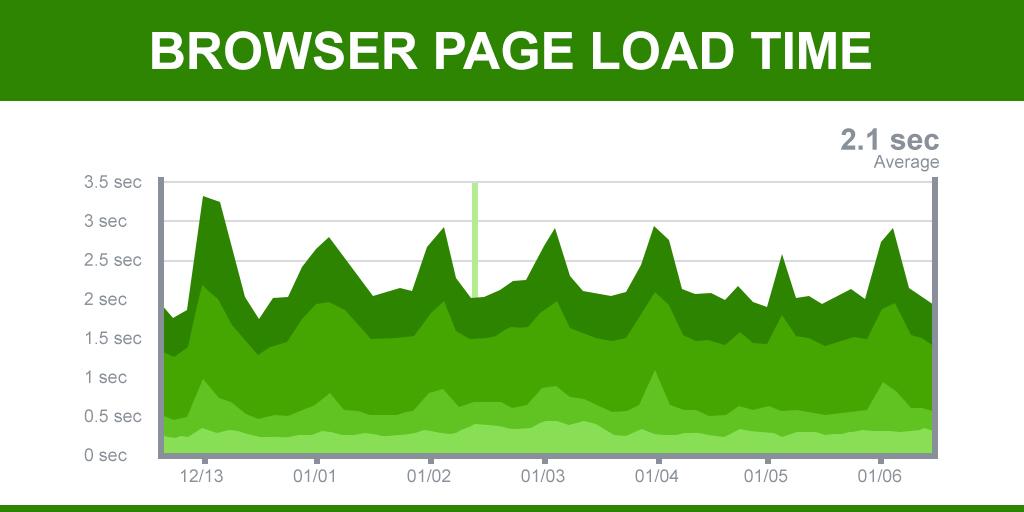
Real User Monitoring (RUM) captures and analyzes each transaction by users of a website or application. JavaScript code is injected on each page and reports on how long each page takes to load data for each request.
Simply put, the data gathered shows the full timing, based on real pages being loaded, from real browsers, in real locations. If a user clicks on a page, within seconds you will see that page load blip on your dashboards.

As the name suggests, this technique monitors actual user interactions. RUM is a form of passive monitoring — it relies on services that constantly observe the system in the background, tracking responsiveness, functionality, and availability.
Synthetic Monitoring is different. Instead of collecting real user data, it simulates it. These scripts periodically visit websites and record the performance data during each run. Synthetic monitoring is a form of active monitoring due to the fact that it is controlled — it requires deployment — and because the recorded does not represent actual users; the traffic is manually generated to collect specific data.
Both RUM and synthetic monitoring give you different views of your performance and are useful for a variety of things. RUM helps with understanding long-term trends, and STM helps diagnose and solve shorter-term performance problems.
Each method has its respective benefits and drawbacks, but when they are complimenting each other together, it is extremely powerful. Below we will cover a few advantages and disadvantages of each. Keep in mind, these offer just a glimpse. You can learn more about each type of monitoring here.

RUM, also known as real user measurement, real user metrics, and end-user experience monitoring, is used to measure user experiences. It uses metrics like transaction paths and load time for analysis. Let’s take a deeper dive.
Understanding page views and load times, site page build performance and users’ browser and platform performance — all across various geographical regions — are key to understanding how your users are doing. A bug-prone, issue-laden site is one of the worst things for your business.
Anyone can have a website nowadays; that’s easy. The hard part is making sure you build rapport with your users and put them first. They should not come across a site that takes forever to load or find it down altogether. Nothing will drive them away faster.

When it comes to application performance, RUM works. One advantage of measuring real data is that there’s no need to pre-define important use cases. All data is captured as each user navigates. So, no matter which pages they view, there will be performance metrics available. This is handy for large sites or complex apps where functionality and/or content is ever-changing.
Like a needle in a haystack, problems at the lower levels of a website or app can be extremely difficult to pick through and resolve, even if they are intermittent or simply just rare in nature. RUM can spotlight these issues and replay user sessions, acting as a magnet to your needle-like problems. This helps your team measure target levels and prioritize tasks based on the severity and frequency of these issues.

Even though RUM has several benefits, it does come with its limitations. When the process is combined with synthetic monitoring, the gaps are filled nicely.
RUM is useful in pre-production environments, but it’s difficult to get useful information here because there is little traffic at this point. RUM only works if people are visiting and using your site. Even with the ability to monitor, capture and analyze every user’s interaction, you still need real, user-generated traffic for it to be meaningful. Therefore, RUM’s greatest asset may also be its greatest weakness.
Many teams use Application Management Tools along with Real User Monitoring for this reason.

Getting a gauge of your website’s performance is difficult. Since RUM is, in essence, random and relies solely on user traffic, it’s hard to indicate persistent issues across the board. Whereas STM can be run consistently, at regular intervals, so it is a better barometer of your site’s performance in comparison with your requirements.
Generally, it’s hard to complain about having too much accurate information. However, the sheer volume of data RUM generates can have its downsides.
For example, 100 users result in 100 times more datasets — RUM’s attention to detail will generate “Y” number of users “Y” times the data. This naturally results in a more accurate diagnosis of end-user experience, but responding to specific issues can prove cumbersome. Leaving the next steps to a potentially over-capacity DevOps team can leave them overwhelmed.
Also referred to as active monitoring or synthetic transaction monitoring (STM), synthetic monitoring is a method used to monitor your applications by simulating users. Meaning, scripts synthetically generate traffic to see how sites perform in the outside world.

Your bottom line is impacted by performance issues. Synthetic monitoring provides feedback about performance and whether or not users will be satisfied. You can see your application and API performance during peak times, at 3 a.m. or before launch, meaning you can find and fix issues before they impact your end users.
The monitors are run from different geographical locations, different browsers running on real ISPs and different devices. Thus, providing insight into response times and metrics like page load time, first paint time, and above-the-fold load times.

Synthetic monitoring affords you the ability to monitor performance at frequencies and locations of your choice, at any time. This data can be used to find areas needing improvement and develop strategies for them. The results can be displayed using a waterfall chart. This creates a visual representation of every request the page makes over the time it was executed, providing an easy way to identify any performance or bottlenecks.

When striving to deliver high-level performance, it is not sufficient to only check availability and uptime of your APIs and applications. STM allows you to emulate business processes and user transactions from different geographies.
For example, it can simulate searching, adding items to cart, logging in, checking out, etc. in order to measure performance. This allows you to compare stats between locations and the steps involved in transactions. In turn, giving you the necessary data to formulate performance improvement plans.

Although it provides consistent and reliable insight about your performance, STM alone can fall short in some areas. A few of these downfalls are highlighted below.
Due to the fact that STM tests are generated through controlled and predictable environments, they don’t track real user sessions. They just aren’t truly representative of what real users are experiencing at any given time.
Because the scripts execute a known set of steps at regular intervals from a known location, its performance is predictable. Therefore, STM cannot tell you what specific end users will definitely experience because it is difficult to gauge all of the unpredictable variables that could potentially impact a real-life customer.
This might depend more on the vendor you choose, but you might find yourself writing new test scripts for each type of monitor you want to implement. If the vendor you’re using doesn’t have a scriptless monitor creation tool — or one that can integrate with the tools you use to script your tests — your options are fairly limited.

Particularly in the synthetic monitoring space, the spectrum seems saturated on both ends. Either you get a high price tag and advanced capabilities, or very barebones capabilities for cheap. Again, this depends on the vendor, but some monitoring tools can start in the realm of $25,000.
Finding a vendor that works WITH you to determine your monitoring requirements and budget is great. But finding a vendor that works FOR you and meets your needs is crucial.
Why not both? RUM data is generated through real user traffic. It is the ground truth for what users are experiencing. It provides a clearer understanding of performance, enabling you to take targeted action and remove performance flaws.
STM ensures that your site properties and critical user transactions are always performing properly, even when there is no real user traffic coming through your site or application. Even when generated using real browsers over a real network, STM can’t match the diversity of performance variables that exist in the real world: browsers, mobile devices, geolocations, network conditions, user accounts, etc.

STM allows us to create a consistent testing environment by eliminating the variables. The variables used for testing do correspond with segments of users, but fail to capture the diversity of users who actually visit a page. That’s where RUM comes in.
Both RUM and STM provide feedback about your site performance, but it varies between the size of the page being monitored and the traffic it generates. On their own, synthetic testing and real user monitoring do not provide the best view you need in order to respond to the changing user demands.
However, using the data from both of these methods gives you the ability to deep-dive into specific issues and resolve shortcomings, providing you with full visibility. With this knowledge, you can gauge how fast your site needs to be in order to ensure user satisfaction and gain a competitive edge.
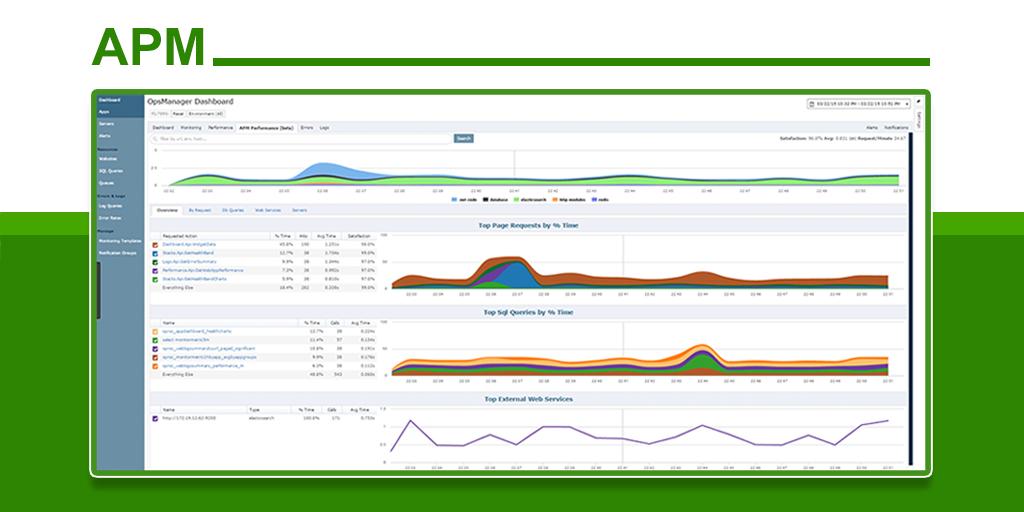
Stackify's APM tools are used by thousands of .NET, Java, PHP, Node.js, Python, & Ruby developers all over the world.
Explore Retrace's product features to learn more.
If you would like to be a guest contributor to the Stackify blog please reach out to stackify@stackify.com