By TechnologyAzure and AWS Monitoring
By IndustryIntegrates with your stack
By InitiativeEngineering & DevOps Teams
TechnicalIt’s easy to get the help you need

We live in a world where nobody is willing to wait for anything. We have become accustomed to websites and mobile apps working instantly. If I click on a search result from Google and it doesn’t load within a couple seconds, I will no doubt just click on a different result. We have all been trained to expect websites to load blazingly fast.
We all know that the performance of our software is important!
We also know that performance optimization can be very time consuming and potentially expensive. We also know that premature optimization is a bad thing.
Web performance optimization is a never-ending job. In this article we will review some of the top server and client-side performance issues and how to resolve them.
Web performance optimization occurs by monitoring and analyzing the performance of your web application and identifying ways to improve it.
Web applications are a mixture of server-side and client-side code. Your application can have performance problems on either side and both need to be optimized.
The client side relates to performance as seen within the web browser. This includes initial page load time, downloading all of the resources, JavaScript that runs in the browser, and more.
The server side relates to how long it takes to run on the server to execute requests. Optimizing the performance on the server generally revolves around optimizing things like database queries and other application dependencies.
Let’s take a deeper look at how to optimize performance for both the client and server sides.
Client performance typically revolves around reducing the overall size of web pages. This includes the size of the files and perhaps more importantly, the number of them.
It is common these days for a single web page to load 100+ files. You can quickly see this via your web browser with the dev tools. For Google Chrome, hit F12 (on Windows), go to the Network tab and then reload a page on your site.
For example, here is what it looks like for the home page of CNN.

As you can see, it took 11.04 seconds to download 188 files to load the page. Yikes!
This gives you a basic understanding of how long it takes and how many files are being downloaded. Your goal is to optimize both of these.
Here are some of the top strategies to optimize performance on the client side
One of the smartest things you can do is leverage a content delivery network (CDN). Many of the files on your website, like JavaScript, CSS, and image files, are static and do not change.
You can increase the performance of your website by caching these files on servers closer to where your users are. This offloads the traffic from your servers and makes your site load faster.
I highly recommend Cloudflare for this. It is extremely simple to setup and just works.
One of the most important things you want you to do is bundle your files together so there are fewer files. You can also optimize their contents to shrink the file size down through various minification techniques.
Unfortunately, bundling and minification typically require code changes to accomplish.
The Cloudflare content delivery network offers a feature called Rocket Loader that can automatically combine your JavaScript for you. I have also used a WordPress plugin called Fast Velocity that is also pretty awesome.
I struggle with this problem a lot. My computer has a 4K monitor so I am always taking pretty large screenshots and inserting them into blog posts. This causes the image files to be large. Also, having multiple screenshots on a page can really slow it down.
Most images can be optimized and made smaller. There are tools for jpeg and png files to help shrink the files. If you are using WordPress, there are plugins that can automatically do it.
If you have a lot of small icons on your pages, you should consider switching to an icon font like Font Awesome or using image sprites.
Lastly, if you have pages that are long with a lot of images, you may want to consider lazy loading your images. This means that on page load, you only load the images that you can see on the screen. As your user scrolls down, you setup your site to load additional images.
No matter which programming language you are using, there are several common issues that cause performance problems.
Web performance optimization isn’t just about optimizing the client. Many performance problems are due to slow SQL queries, hidden errors, and other issues.
Most software applications use SQL databases, caching, external web services, and other application dependencies. These are things like SQL Server, Oracle, Redis, MongoDB, Elasticsearch and external HTTP web services.
The best way to evaluate how your code is using application dependencies and how they perform is by code profiling. Products like Retrace are safe to use on your servers and can instantly show you which dependencies are being used and how long they take.
Below is an example of a typical web application with pretty consistent traffic and performance.

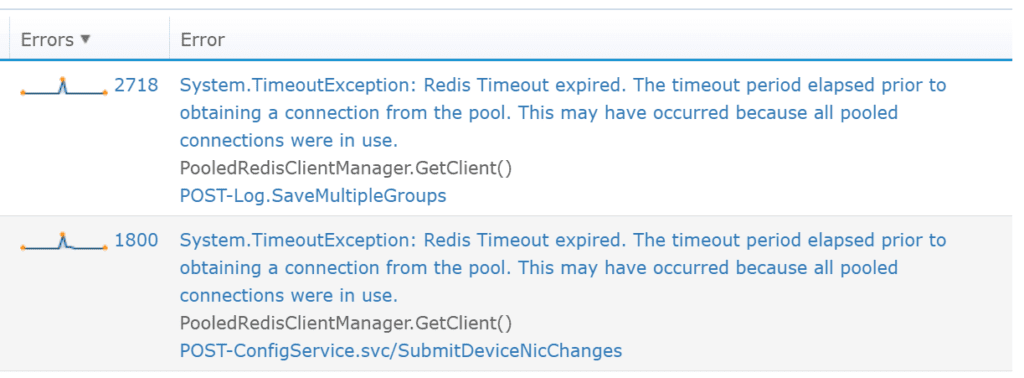
In this example below you can quickly identify that Redis is causing big performance spikes.

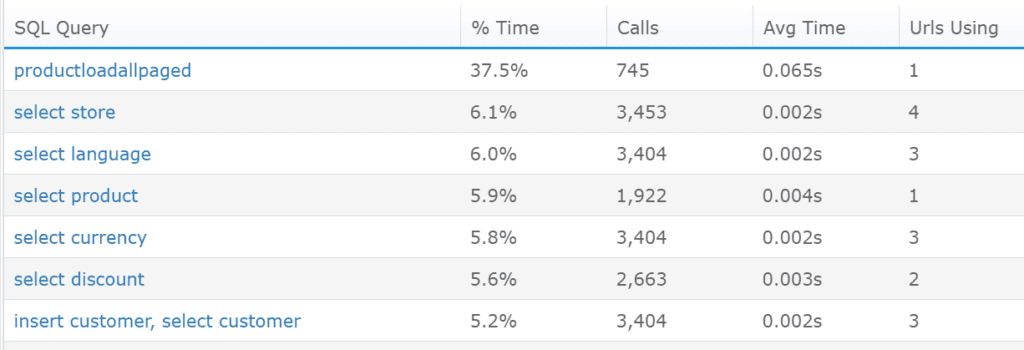
One of the common problems is identifying slow SQL queries and figuring out how to improve their performance. Another common issue is identifying SQL queries that are being called too often.

Your application is probably throwing all sorts of exceptions that you don’t even know about. Exceptions are one of the best ways to identify bugs and even performance problems in your code.
Retrace can collect and provide excellent reporting about all the exceptions that are being thrown within your code.

Exceptions themselves cause a lot of performance overhead. An application that throws thousands of exceptions a minute will consume a lot more CPU than it should.
This is a common problem in code that does a lot of data parsing in “try catch” blocks and just ignores any exceptions being thrown.
Learn more: How GWB Found Hidden Exceptions and Application Performance Problems
[adinserter block=”33″]
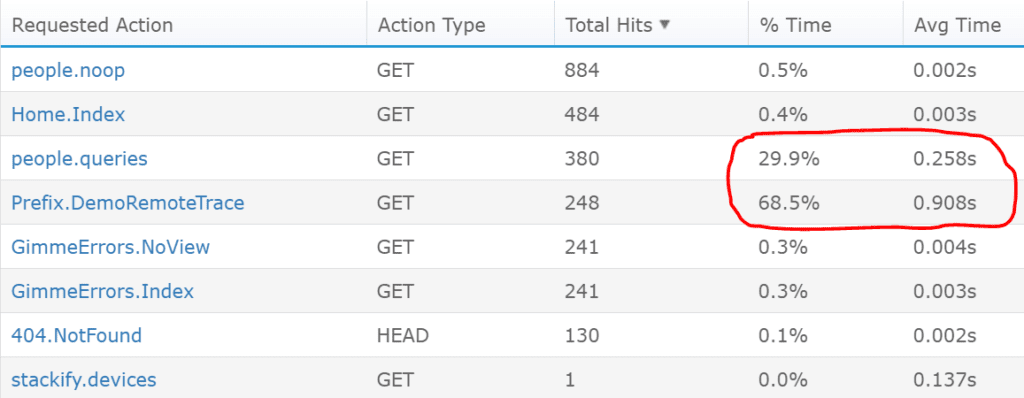
If you don’t know which pages on your site are used the most and which ones are the slowest, you definitely should.
You could try and do this by parsing the logs from your web server. This is a nightmare if your web application uses REST URLs because most of the URLs will be unique.
An easier way is using an application performance management solution like Retrace.
Your goal is to identify which requests are being used the most and which ones are taking up the most amount of time on your server. This helps you prioritize where to do performance tuning.

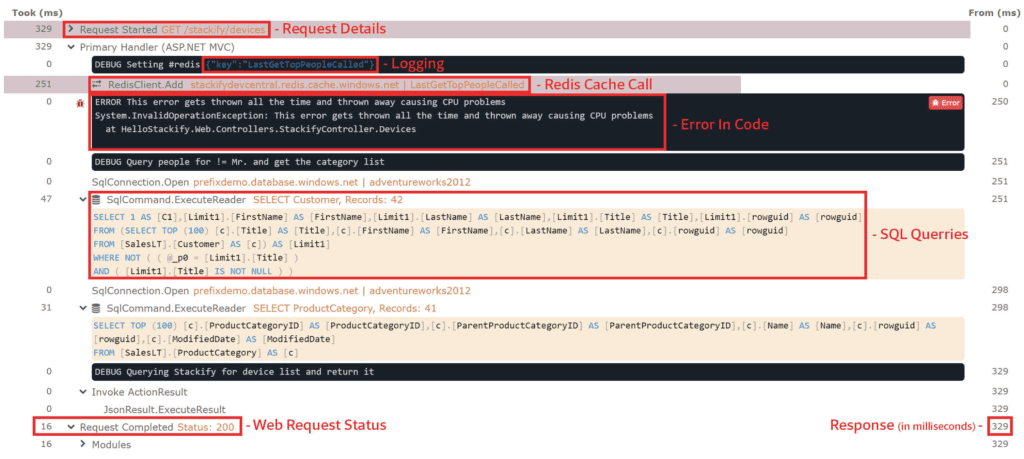
With Retrace, you can also view code-level performance to understand exactly what it is doing.

Web performance optimization is a job that is never done. As you continue to make changes to your software and roll out new features, its usage and performance will continue to change.
I recommend reviewing your application performance monitoring tools like Retrace on a weekly basis, looking for things that could use some improvement. You can then prioritize these work items as part of your next sprint.
Also be sure to check out some of our other guides about application performance.
Stackify's APM tools are used by thousands of .NET, Java, PHP, Node.js, Python, & Ruby developers all over the world.
Explore Retrace's product features to learn more.
If you would like to be a guest contributor to the Stackify blog please reach out to stackify@stackify.com