By TechnologyAzure and AWS Monitoring
By IndustryIntegrates with your stack
By InitiativeEngineering & DevOps Teams
TechnicalIt’s easy to get the help you need
Monitoring a running application is crucial for visibility and making sure the system is functioning as expected, as well as to identify any potential issues, tweak and optimize the running conditions, and resolve any errors that may occur.
This is where Application Performance Monitoring (APM) tools can make your life a whole lot easier by recording information about the execution of your application and displaying it in a helpful and actionable format.
I’ll walk you through examples of the following metrics:
The response time of an application represents the average time your application takes to process requests and return a result.
If your system takes too long to respond, this will lead to low user satisfaction. Additionally, monitoring the response time can help uncover errors in the code.
The Retrace Performance tab shows average response time of each HTTP request, along with number of hits and satisfaction rate:

Here you’ll notice the login endpoint takes the majority of total request time with only 6 hits. Comparatively, the doGet endpoint is the fastest and most frequently accessed.
Nevertheless, all the requests have an average time of less that 0.5 seconds, which means they are fairly fast.
The default threshold under which Retrace will mark requests as fast is 2 seconds. You can modify this according to your requirements for more informative graphs.
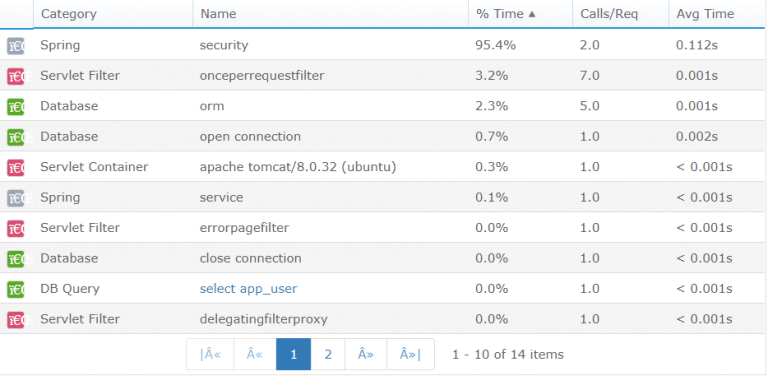
What’s more, you can find a performance breakdown for each request, to get to the root of any lags. Let’s take a look at a more detailed view of the behind the scenes for the /j_spring_security_check request:

Learn more: Hit the Ground Running with the Spring Security Java Configuration
This list of actions shows the average time for each step of the login request.
Since this is a critical action for using the application, let’s set up a dedicated monitor for it by marking it as a “key transaction” in Retrace.
This will result in creating a table on the Monitoring tab that contains information solely regarding the login request:

At the last update, the login endpoint was called 3 times and took 0.2 seconds on average. The satisfaction rate was 100%, which equals a 0% error rate.
In addition to average response time for a type of request, another metric of interest is response time and result of each individual request.
You’ll find these in the Traces tab:

This list also shows the response status of each request performed. In this case, one of the requests resulted in a 404 response, which did not register as an error.
Another metric that highlights the performance of an application is request throughput. This represents the number of requests that the JVM can handle for a certain unit of time.
Knowing this data can help you tune your memory, disk size, and application code according to the number of users you aim to support.
Retrace provides a graph that maps the number of requests per minute. These are highlighted according to speed and success:

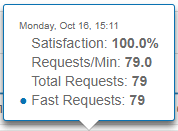
You can find more details by choosing a specific time. For example, the highest point at 15:11 shows there have been a total of 79 requests in the last 10 minutes. Out of these, 79 were fast:

Next to monitoring the response time per request, you can verify the same per SQL query for the requests that involve accessing a database.
Working with a database can be an intensive process. That’s why it’s important to ensure there are no performance bottlenecks hiding at the database level.
Retrace automatically monitors SQL queries similarly to HTTP requests:

In the above image, each database command generated by the application is displayed in a simplified form. Alongside is the number of calls and average time per query.
This way, you can find out which database calls are the most common, and which take a longer time.
By selecting each query, you’ll be able to view the plain SQL command. Next to it is a list of all the HTTP requests that required the database call. This correlation shows how the query impacted the HTTP request.
Next to performance metrics, of course, it’s crucial to directly keep track of the errors that occur.
The Retrace Dashboard provides an Errors section where you can find a list of errors during a selected period of time:

For each of these, you’ll be able to view the full stack trace, plus other helpful data like the exact time of the error, the log generated by the error, other occurrences of it and a list of similar errors.
All this information is meant to provide clues into finding the root cause and fixing the issue. Having this data easily available through Retrace can greatly cut down on the time spent resolving problems.
Each application will very likely use a logging framework to record information about what happens during its execution.
This is very useful for both auditing purposes and helping track down the cause of any issues.
For that reason, you should also monitor your application’s logs using a log viewer such as the one Retrace provides:

The advantage of using a tool instead of directly reading the log is that you can also search through the log or filter the statements according to the log level, host, environment or application that generated it.
An APM tool like Retrace can also present aggregated metrics that show a high-level view of your application.
One such metric is overall system health:

This shows the rate of user satisfaction compared to the rate of HTTP errors.
On the Performance tab, you’ll find a breakdown of the requests based on the type of application resource they use:

For the example Reddit scheduling application, the Breakdown graph shows the servlet and Spring containers processing the requests for the largest time of their duration.
A metric specific to the tool you’re using is the number of alerts your application has generated:

This shows there have been 2 alerts of severity Warning and one alert with a Critical level.
If your application uses any external web services, Retrace also records these in the Performance tab. For each of these, the tool will record data regarding the time of the call and its response time.
Finally, Retrace also supports defining and adding your own custom metrics.
Above all, an APM tool is a must-have for the success of your application. Get started with a free trial of Retrace. Learn how to start improving your Java applications today.
Stackify's APM tools are used by thousands of .NET, Java, PHP, Node.js, Python, & Ruby developers all over the world.
Explore Retrace's product features to learn more.
If you would like to be a guest contributor to the Stackify blog please reach out to stackify@stackify.com