By TechnologyAzure and AWS Monitoring
By IndustryIntegrates with your stack
By InitiativeEngineering & DevOps Teams
TechnicalIt’s easy to get the help you need

In this article, we’ll cover how you can monitor an application that runs on the Java Virtual Machine by going over some of the critical metrics you need to track. And, as a monitoring tool, we’ll use Stackify Retrace, a full APM solution.
The application we’ll monitor to exemplify these metrics is a real-world Java web application built using the Spring framework. Users can register, login, connect their Reddit account and schedule their posts to Reddit.
There are two important types of JVM memory to watch: heap and non-heap memory, each of these with its own purpose.
The heap memory is where the JVM stores runtime data represented by allocated instances. This is where memory for new objects comes from, and is released when the Garbage Collector runs.
When the heap space runs out, the JVM throws an OutOfMemoryError. Therefore, it’s very important to monitor the evolution of free and used heap memory to prevent the JVM from slowing down and eventually crashing.
The non-heap memory is where the JVM stores class-level information such as the fields and methods of a class, method code, runtime constant pool and internalized Strings.
Running out of non-heap memory can indicate there is a large number of Strings being internalized or a classloader leak.
Retrace can provide information regarding JVM memory status based on existing JMX beans.
To view this graph, you first have to enable remote JMX monitoring on your server. Then, you have to set up the JMX connection in Retrace.
Finally, in the Dashboard corresponding to your application, you’ll find the JVM Memory graph:

Here you can check the evolution of both types of memory over a selected time period, as well as mouse over the graph to find the exact values at a given time.
Of the total 400 MB the example application started with, approximately half are free at any time, which is more than enough for its proper functioning. If you notice that you’re running low on memory, you can increase the JVM memory on startup, as well as investigate a potential memory leak.
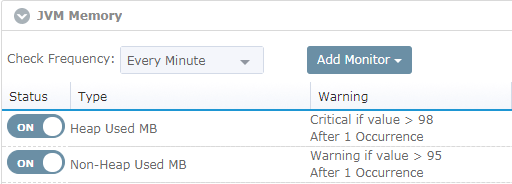
With Retrace, you can also set up monitors for a certain metric’s values with different severity levels.
Let’s set up two monitors for JVM heap and non-heap memory:

If the memory exceeds any of these thresholds, you’ll receive a notification on the Retrace dashboard.
[adinserter block=”33″]
In conjunction with JVM memory, it’s important you monitor the garbage collection process, since this is the process that reclaims used memory.
If the JVM spends more than 98% of the time doing garbage collection and reclaims less than 2% memory, it will throw an OutOfMemoryError with the message “GC Overhead limit exceeded”.
This can be another indication of a memory leak, or it can simply mean the application needs more heap space.
Retrace can show you how many times the GC runs per minute and how long each run lasts on average:

These metrics are also based on JMX beans and split between minor and major collections.
The minor collections free up memory from Young Space. The major collections reclaim memory from Tenured Space, which contains objects older than 15 GC cycles.
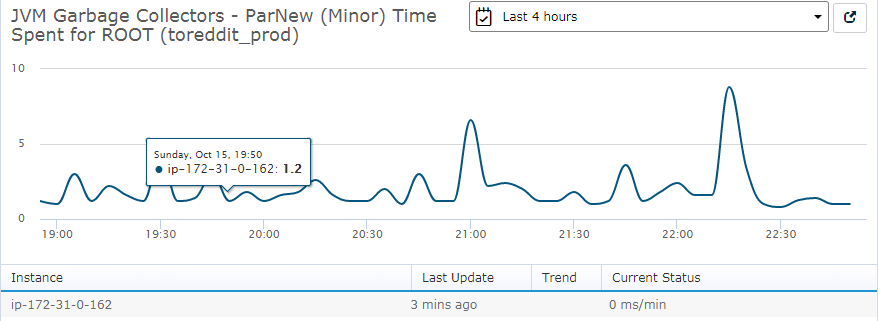
You can then verify each metric in more detail:

Here, minor collections take a maximum time of 9 ms.
The GC runs are not very frequent, nor do they take a long time. Therefore, the conclusion, in this case, is that there is no heap allocation issue in the application.
Another JVM metric to monitor is number of active threads. If this is too high, it can slow down your application, and even the server it runs on.
Let’s verify JVM threads status in the Retrace Dashboard:

Currently, there are 35 active threads.
The dashboard displays the same information as a graph over a period of time:

In this case, the JVM uses 34 active threads on average.
A higher number of threads means an increase in processor utilization caused by the application. This is mainly due to the processing power required by each thread. The need for the processor to frequently switch between threads also causes additional work.
On the other hand, if you expect to receive a lot of concurrent requests, then an increase in number of threads used can be helpful to decrease the response time for your users.
You can use this information in association with the CPU utilization percentage to verify if the application is causing high CPU load:

In the graph above, the CPU utilization is less than 1% so there is no reason for concern.
Of course, you can set monitors for each of these metrics in the same way as the JVM memory monitor.
The JVM is a complex process that requires monitoring for several key metrics that indicate the health and performance of your running application.
APM tools can make this task a lot easier by recording data on the most important metrics and displaying it in a helpful format that’s more convenient to read and interpret. As a consequence, choosing the right APM tool is vital for successfully running and maintaining your application.
Stackify Retrace provides information on the most commonly utilized JVM metrics in both text and graph form. Also, you can use it to set monitors and alerts, add custom metrics, view and filter logs and configure performance management.
Above all, an APM tool is a must-have for the success of your application.
Stackify's APM tools are used by thousands of .NET, Java, PHP, Node.js, Python, & Ruby developers all over the world.
Explore Retrace's product features to learn more.
If you would like to be a guest contributor to the Stackify blog please reach out to stackify@stackify.com