By TechnologyAzure and AWS Monitoring
By IndustryIntegrates with your stack
By InitiativeEngineering & DevOps Teams
TechnicalIt’s easy to get the help you need

Microsoft and the .NET community have made asynchronous programming very easy with their implementation of async await in C#. The latest versions of ASP.NET heavily utilize it to improve performance. Many performance monitoring and profiling tools struggle to support and visualize the performance of asynchronous C# code.
Stackify’s Prefix & Retrace products both have excellent support for applications using C# async await. In this article we will show how you can use Stackify’s free profiler, Prefix, to understand the performance of your async .NET code.
To start, I thought it would be useful to show how code that uses async await actually works. When your code gets compiled, the compiler does a lot of magic under the covers that are really interesting.
Let’s use this basic usage of the HttpClient as an example.
[HttpGet, Route("api/HttpClient/GetGWB")]
public async Task<bool> GetGWB()
{
    HttpClient hc = new HttpClient();
    await hc.GetAsync("http://geekswithblogs.net/Default.aspx");
    return true;
}
By using ILSpy, you can see how the compiler converts this code to use an AsyncStateMachine. The state machine does all the complicated code under the covers that makes it easy for us developers to write asynchronous code. Check out this CodeProject article for an even more detailed example.
[DebuggerStepThrough, AsyncStateMachine(typeof(HttpClientController.<GetGWB>d__3)), HttpGet, Route("api/HttpClient/GetGWB")]
public Task<bool> GetGWB()
{
	HttpClientController.<GetGWB>d__3 <GetGWB>d__ = new HttpClientController.<GetGWB>d__3();
	<GetGWB>d__.<>4__this = this;
	<GetGWB>d__.<>t__builder = AsyncTaskMethodBuilder<bool>.Create();
	<GetGWB>d__.<>1__state = -1;
	AsyncTaskMethodBuilder<bool> <>t__builder = <GetGWB>d__.<>t__builder;
	<>t__builder.Start<HttpClientController.<GetGWB>d__3>(ref <GetGWB>d__);
	return <GetGWB>d__.<>t__builder.Task;
}
Profiling async code is complicated because it jumps across threads. Traditionally, a method and all of its child method calls all happen on the same thread. That makes it easy to understand the relationship between parent and child methods.
With asynchronous code, that is an entirely different story. A parent method starts on one thread. When an I/O operation starts, code on that thread ends. When the I/O operation completes, the code continues to run on a new thread. Associating code across those threads as part of a larger transaction is complicated.
To give you an idea of the complexity of what happens under the covers, here is a high-level overview of what actually happens for our simple HttpClient example.
Note: This is actually even more complex than this. I have simplified it down some for brevity.

Thread #1
Starting IIS pipeline steps & HTTP modules
HttpControllerHandler.ProcessRequestAsyncCore (Web API parent method)
  -> HttpClient.SendAsync (Call the HttpClient method)

Thread #2
HttpWebRequest.BeginGetResponse (Internal class that executes HTTP request)

Thread #3
_IOCompletionCallback.PerformIOCompletionCallback
  -> HttpWebRequest.ProcessResponse (Internal class the handles the response headers of HTTP request)
     -> HttpClient.StartContentBuffering (Start downloading response body stream of HTTP request)

Thread #4
HttpControllerHandler.CopyResponseAsync (Start sending response of Web API action)

Thread #5
IHttpAsyncHandler.EndProcessRequest (End method of primary handler)

Thread #6
Final IIS pipeline steps & HTTP modules (End of request)

Note: There were dozens of other threads also used as part of downloading segments of the HTTP response body.
Based on this simple example, I hope you can appreciate why profiling asynchronous code is so hard.
One of the key features of Prefix and Retrace both is our excellent code-level trace views. They give developers exactly what they are looking for to understand what their code is doing and how long it takes. Our products have excellent support for C# async await code.
Prefix perfectly handles this async code and even shows how long it took to receive the response headers versus downloading the entire response stream body. It also shows things like the HTTP status code and length of the response.

How do Application Insights handle asynchronous HttpClient calls?
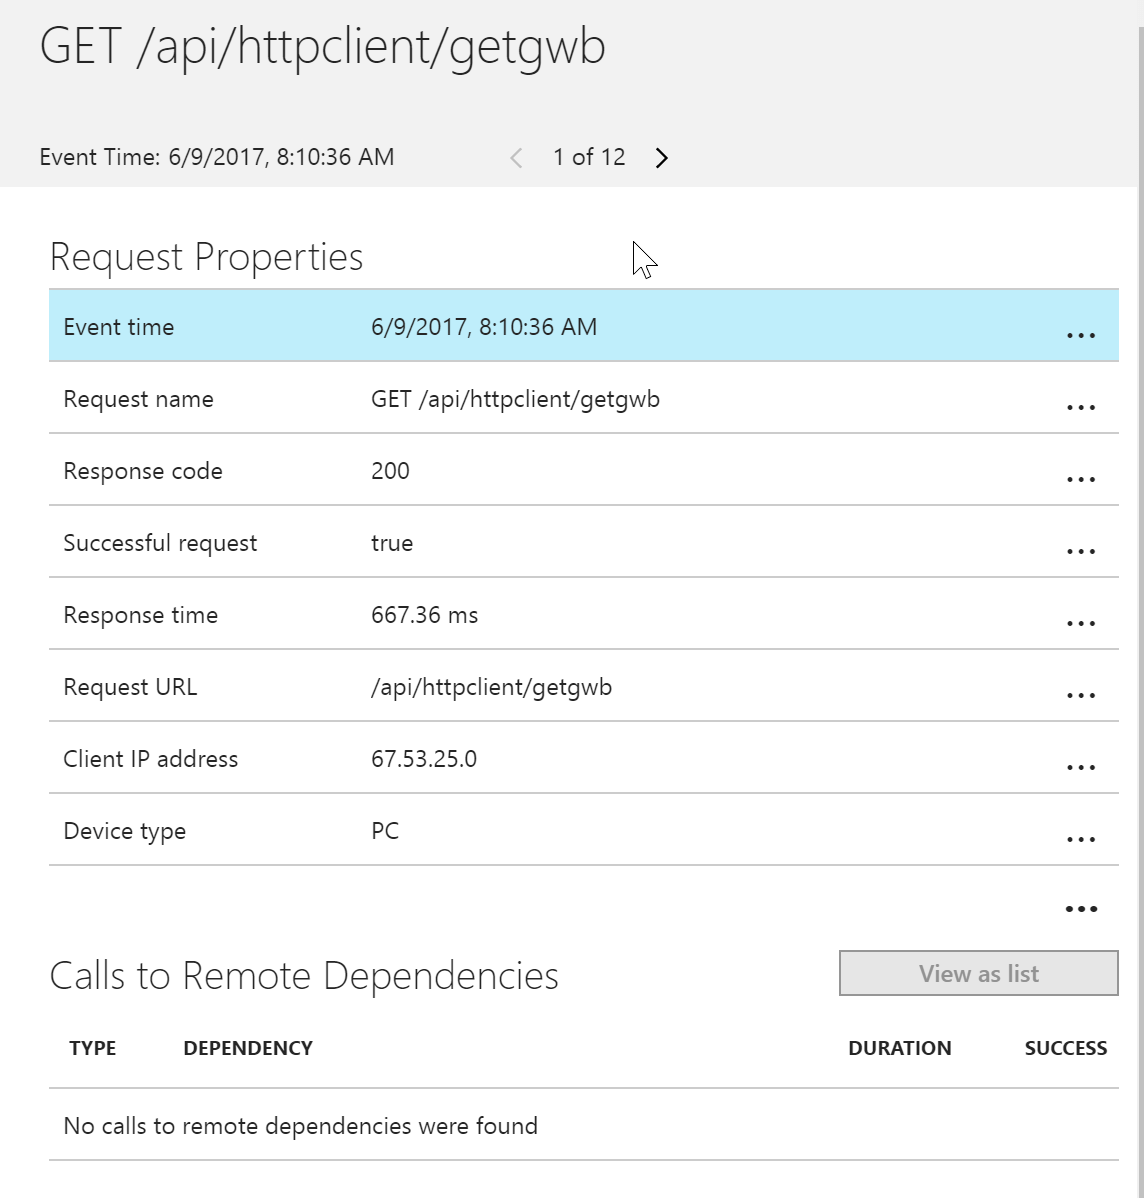
If you were using Application Insights, here is what you would see. They track HTTP calls as “Remote Dependencies.” Notice below it says “No calls to remote dependencies were found.”

Application Insights doesn’t support HttpClient. Weird huh? This is one of many reasons why developers prefer Retrace.
If your code has to do multiple things and then collect the results at the end, you can take advantage of running them in parallel. This is perfect for running multiple SQL queries, web service calls, etc.
For this simple example, we will use the HttpClient again and do 3 separate calls at the same time. When doing this, you don’t want to do an await on each method. You want to do an await on the Task.WhenAll at the end.
[HttpGet, Route("api/HttpClient/TestHttpGetsCrossed")]
public async Task<bool> TestHttpGetsCrossed()
{
    HttpClient hc = new HttpClient();

    var t1 = hc.GetStringAsync(GET_URL); //task #1
    var t2 = hc.GetByteArrayAsync(GET_URL); //task #2
    var t3 = hc.GetAsync(GET_URL); //task #3

    await Task.WhenAll(t1, t2, t3); //await on all of them!!
    return true;
}
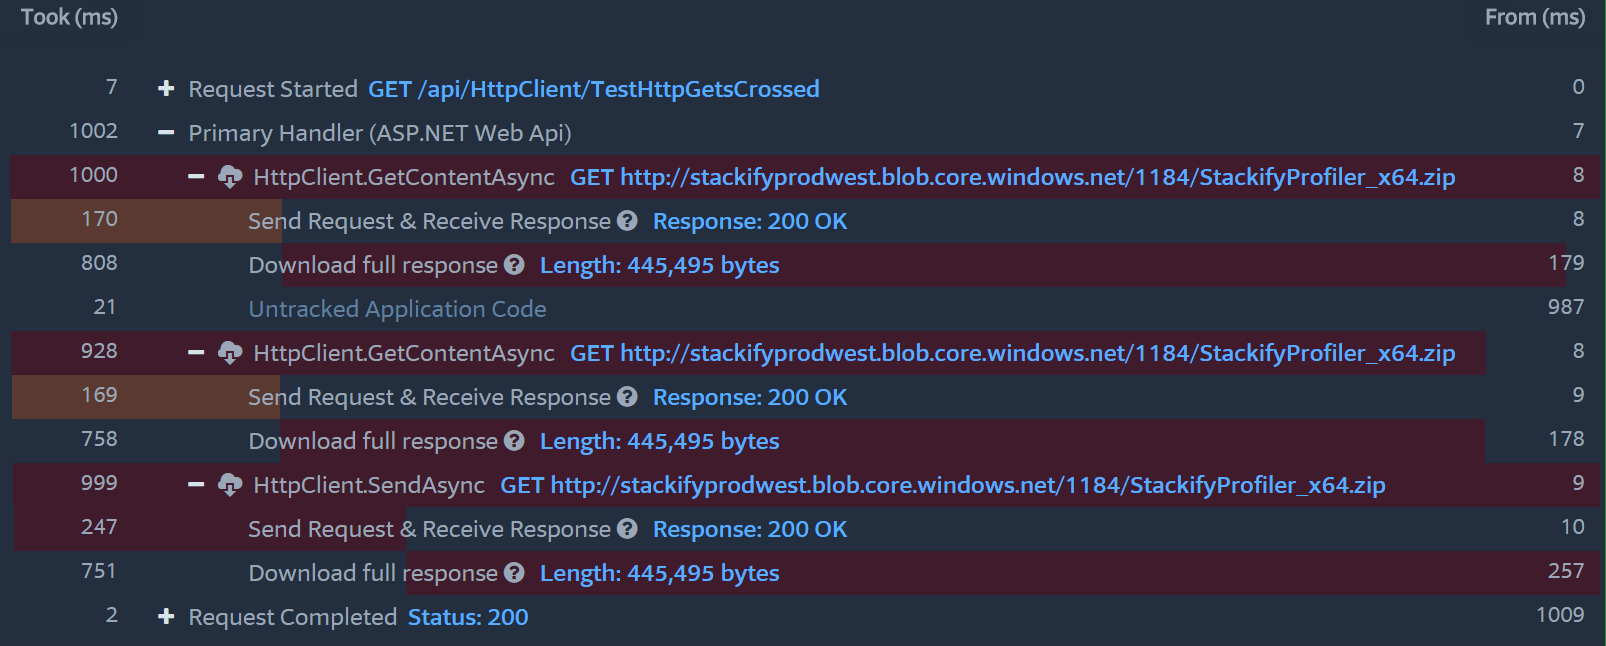
Our products perfectly support these sort of scenarios as well. Below you can see what the 3 parallel web requests look like.

Each one takes about 1 second each. If you did them in a series, the request would take roughly 3 seconds. By doing them in parallel, it only took about 1 second. Utilizing parallel async tasks can be really powerful.
OK, how about a really crazy example?
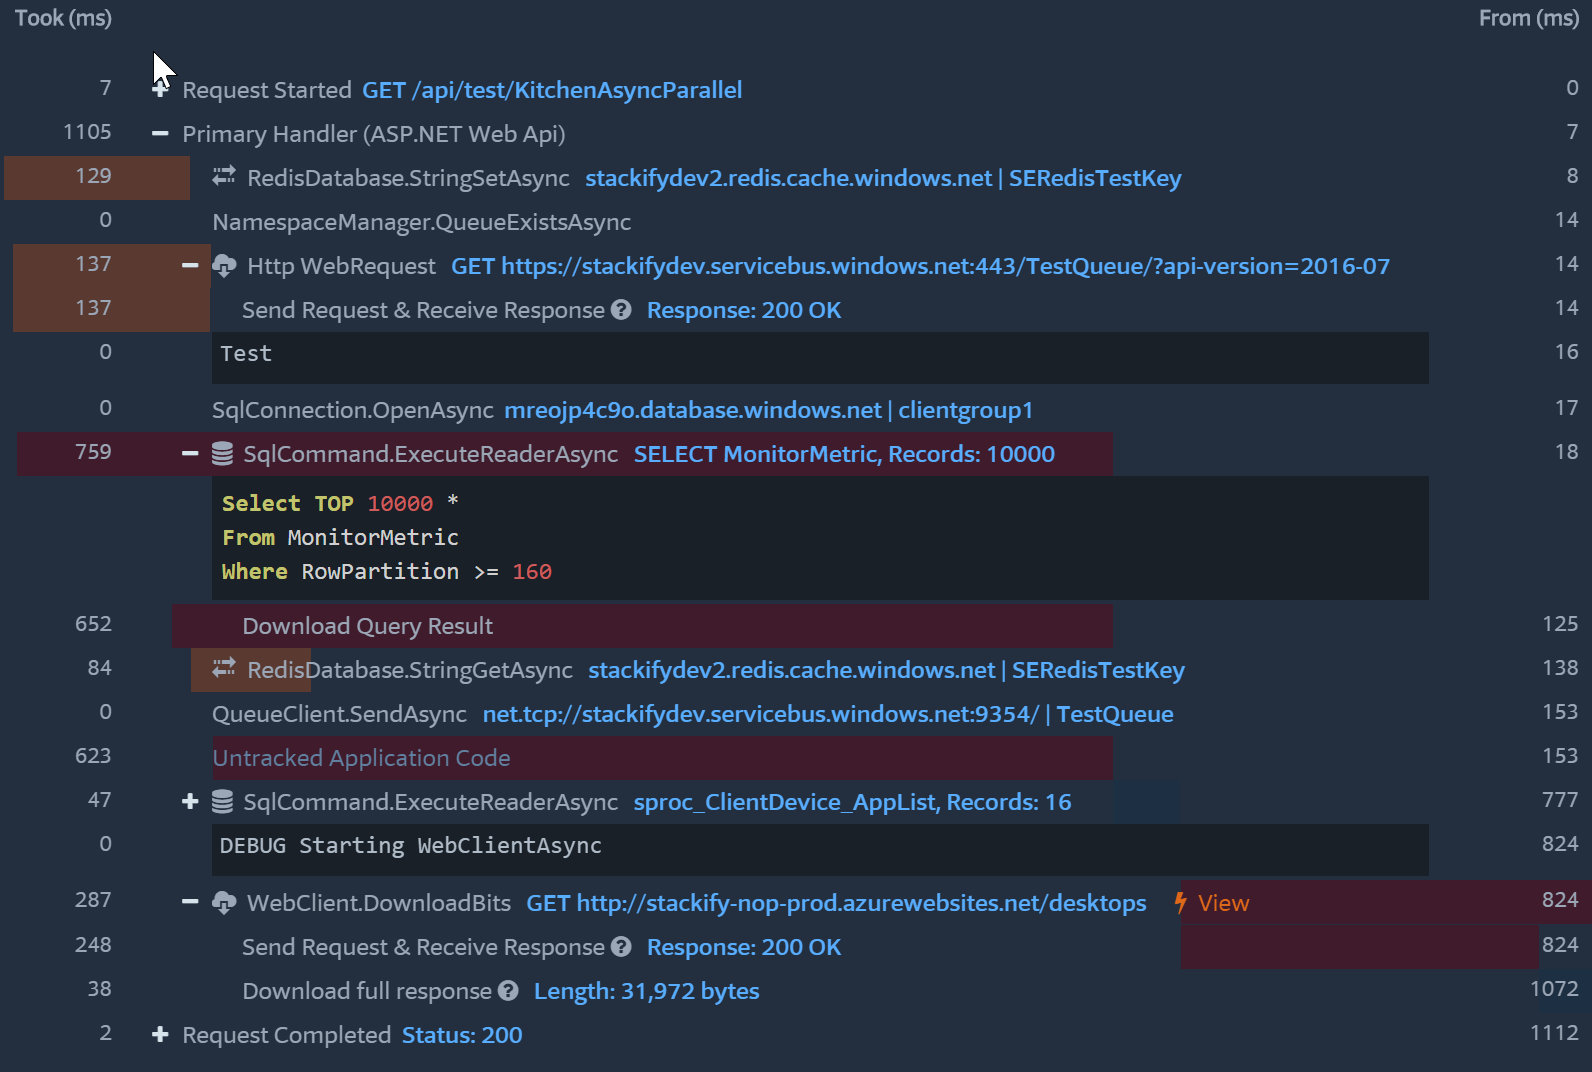
In this crazy example, we are doing a weird mix of operations in parallel and in series.
[System.Web.Http.HttpGet]
[System.Web.Http.ActionName("KitchenAsyncParallel")]
public async Task<HttpResponseMessage> KitchenAsyncParallel()
{
	var task1 = SERedisAsync();
	var task2 = AzureServiceBus();
	await DBTestAsync();

	await task1; //Wait for Redis to finish

	await WebClientAsync();
	await task2; //wait for service bus to finish

	return Request.CreateResponse(HttpStatusCode.OK, Guid.NewGuid().ToString());
}
No problem! Prefix & Retrace can help you visualize it.

Profiling C# async await code is complicated. Trying to visualize what it is doing can be even more complicated.
All the examples in this article were done via our free product, Prefix. It runs on your workstation and helps you understand what your code is doing and how it performs. Our server based product, Retrace, provides the same visualization for your production and non-production applications. Retrace starts at just $10 a month.
Stackify's APM tools are used by thousands of .NET, Java, PHP, Node.js, Python, & Ruby developers all over the world.
Explore Retrace's product features to learn more.
If you would like to be a guest contributor to the Stackify blog please reach out to stackify@stackify.com