By TechnologyAzure and AWS Monitoring
By IndustryIntegrates with your stack
By InitiativeEngineering & DevOps Teams
TechnicalIt’s easy to get the help you need

Exceptions can cause big performance problems. One of the most important performance metrics to track about your application is “# of Exceps Thrown / Sec“. It is available via Windows Performance Counters under the category .NET CLR Exceptions. In this article we will talk about exceptions, how to monitor your exception rate and find the actual exceptions being thrown.
It is common for most applications to throw some exceptions. Don’t worry if this counter is not zero. It is important to understand what is normal for your specific application and what the exceptions are. Also, remember that this counter includes all thrown exceptions, that does not mean they are all unhandled exceptions that cause big problems for your users.
For example, our applications commonly throw exceptions due to transient type issues connecting to Azure resources, external web services, etc. We also throw a lot of exceptions trying to parse possible JSON strings. We use retry logic and good exception handling best practices in our code to handle these types of normal problems.
Using our app as an example, we expect a certain amount of “noise” in our # of Exceps Throw / Sec and you should too. For us, 5-10 exceptions per second is nothing to be alarmed about in some of our apps.
I have seen applications throw 100 exceptions per second. That is a serious problem!
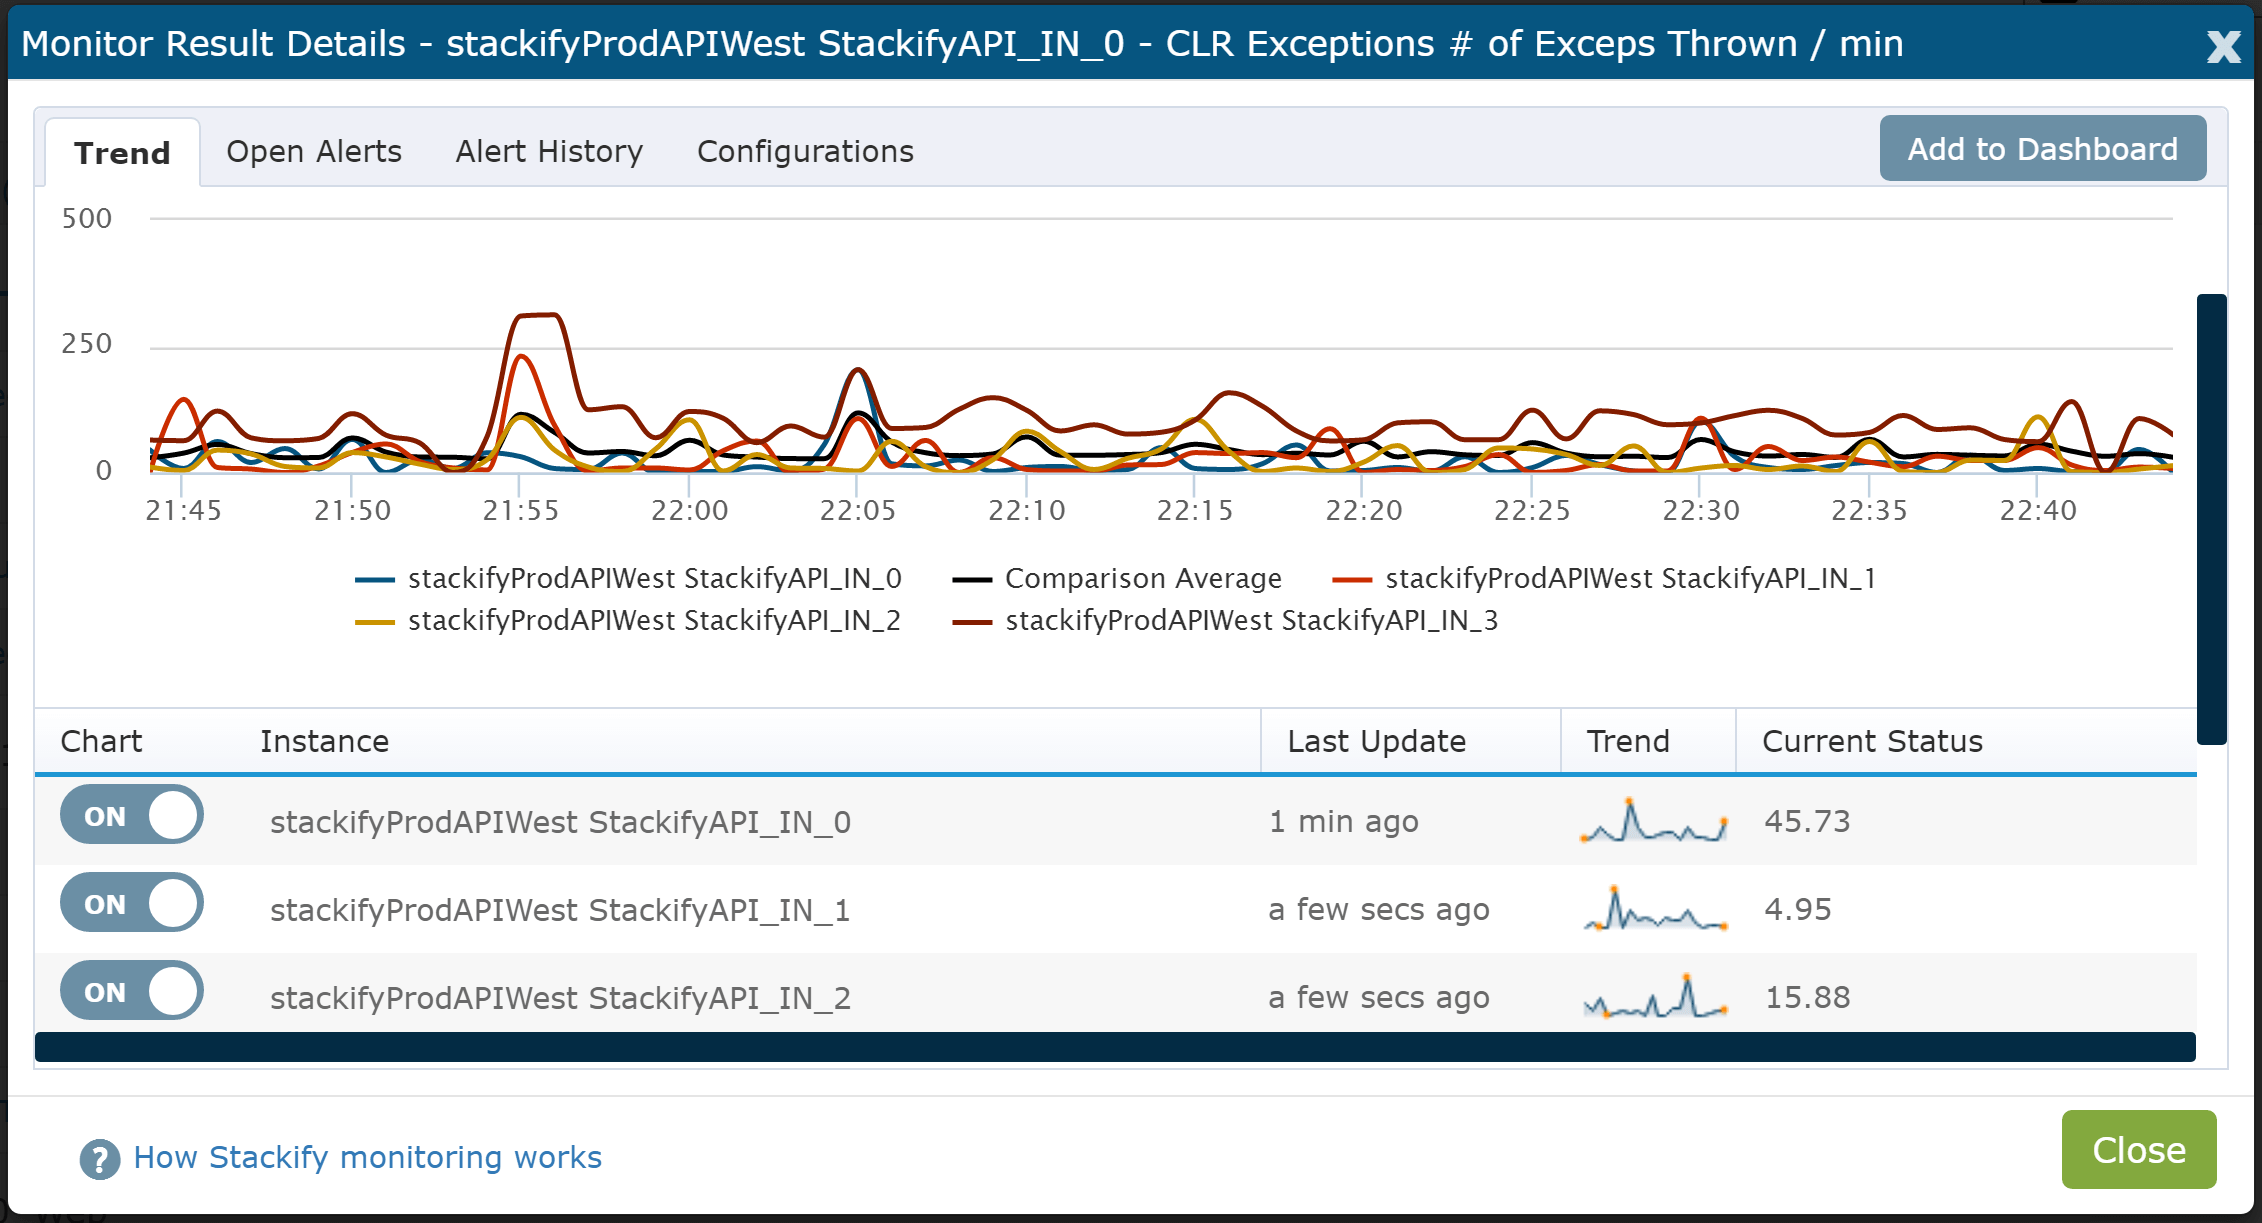
I highly recommend tracking # of Exceps Throw / Sec within your monitoring system so your understand what is normal for your application and can identify spikes or changes.
MORE: How GWB Found Hidden Exceptions and Application Performance Problems
If your # of Exceps Throw / Sec seems like a high number and your application logging doesn’t show any exceptions, the exceptions are being handled but not logged somewhere in your code. Your application is “swallowing” or “throwing away” the exceptions
Luckily, .NET provides an easy mechanism to view all exceptions that are being thrown. You can see every exception, no matter why it is thrown or how it is handled. This functionality is called first chance exceptions.
Our blog post about C# exception handling best practices does a great job of covering first chance exceptions and a few ways to find hidden exceptions in your code.
If you can easily modify your code, I would recommend subscribing to the .NET even for first chance exceptions. You can then log all of the exceptions however you prefer.
AppDomain.CurrentDomain.FirstChanceException += (sender, eventArgs) =>
{
        //log.Debug ...
};
The easiest thing to do is sign up for a 14 day free trial of Retrace and install it on your server. By default, Retrace only collects unhandled exceptions to avoid collecting a lot of noise. Within the environment settings, you can set it to collect all thrown exceptions.
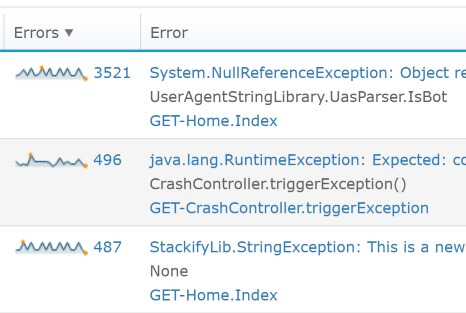
Retrace will show you the exact exceptions that are being thrown, the stack traces, and uniquely identify all your exceptions.

MORE: Advanced Error Monitoring, Tracking & Reporting with Retrace
One of the great features of Retrace is smart defaults of monitoring key application metrics like # of Exceps Thrown / Sec. If you are not using Retrace, check if your server or application monitoring tools can monitor Windows Performance Counters and set it up to do so.

Stackify's APM tools are used by thousands of .NET, Java, PHP, Node.js, Python, & Ruby developers all over the world.
Explore Retrace's product features to learn more.
If you would like to be a guest contributor to the Stackify blog please reach out to stackify@stackify.com